
Mathematics Events at the 2013 AAAS Meeting
 |
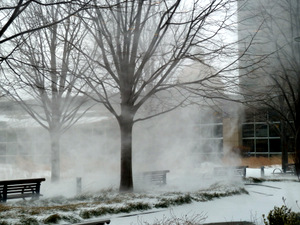 |
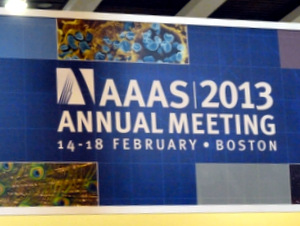
The 2013 annual meeting of the American Association for the Advancement of Science (AAAS) took place at the Hynes Convention Center in Boston, February 14-18. Just to make sure people weren't tempted to overstay their welcome, the Boston Chamber of Commerce arranged to have some wintry weather near the end of the meeting (fortunately, accumulations were nowhere near two feet).
Approximately 9,000 people attended the meeting, roughly one-third of who came for Family Science Days. The AMS held its contest Who Wants to Be a Mathematician as one of the events those days, and hosted a booth in the exhibits area. Below are descriptions of some of the events related to mathematics that took place at the meeting.
Symposia: * Tipping Points * The Complexity of the Financial System * Compressive Sensing * Math and Art
AMS Exhibit
 |
 |
The AMS was the only mathematics organization that hosted an exhibit at the meeting. AMS Public Awareness Officer Annette Emerson and Assistant Director of the AMS Washington Office Anita Benjamin staffed the exhibit, which featured the 2013 Calendar of Mathematical Imagery and the Mathematical Moments program--a series of 100 posters that promote appreciation of the role mathematics plays in science, nature, technology and human culture. Among the other items offered were the "Powered by Math II" poster; the 2013 Mathematics Awareness Month "Mathematics of Sustainability" theme poster; selected AMS books (including A Mathematical Medley, Mathematics and Music, Famous Puzzles of Great Mathematicians and The Mathematical Education of Teachers II). Evelyn Lamb, 2012 AMS-AAAS Media Fellow, and many others tweeted throughout the meeting; you can follow the hashtag #AAASmtg. Visitors to the exhibit included scientists, press, teachers, and Family Days participants. Many of the latter picked up materials to bring back to colleagues and students
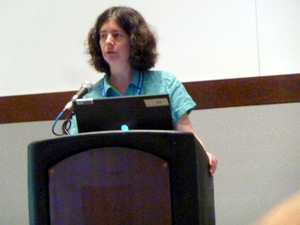
The Mathematics of Tipping Points, organized by Mary Lou Zeeman (pictured below introducing the symposium), Bowdoin College, and Mary Silber, Northwestern University
 |
 |
Silber was the first speaker and gave the large audience insights into tipping points and bifurcation theory. She began by saying that tipping points involve
- a threshold
- a qualitative change in a system's behavior, and
- hysteresis.
She then gave a detailed analysis of Earth's energy balance, especially in regard to ice albedo feedback. Ice reflects heat better than land or water does, so in simple terms less ice means more heat is trapped, which means a warmer planet, which means less ice ...
 |
 |
Silber showed graphs illustrating how a change in the amount of energy radiated out (right) could result in a loss of equilibrium and movement along the S-curve above. It is unknown whether the movement would be to a nearby state or to one that is far away. In the image above, the planet is in a "hothouse" state. (Images above by Mary Lou Zeeman and Mary Silber.)
The second speaker at this symposium, Sebastian Wieczorek (University of Exeter, UK), examined tipping points that he thinks are caused by changes in rates of quantities in a system, rather than by bifurcations. His primary example was peat lands, which relate on a smaller scale to compost piles. The latter can spontaneously combust, so does this means that if the planet warms, then peat could spontaneously combust as well? Wieczorek said that instability results when the soil temperature (which is related to soil carbon content and the atmospheric temperature) rises too fast, which in this case was linked to an atmospheric temperature rise of 8oC/100 years. He concluded by asking whether mathematics could suggest new techniques to predict tipping points.
That conclusion was a good segue to the next speaker, Marten Scheffer (Wageningen University, Netherlands) whose talk was titled, "Anticipating Critical Transitions." We may not be able to understand completely the systems, because they are so complex, but there may be a way to see a tipping point coming. Scheffer showed temperature data and pointed out that historically a slowing down of temperature fluctuations and an increased autocorrelation presaged eight abrupt climate changes.
He also talked about three different habitats: forest, savannah, and deserts. Regions tend to settle in to one or the other, but nothing in between. In regions with lots of rain, for example, there is one equilibrium: a forest. In regions with a medium amount of rain, there are two equilibria: forests and savannah. People can use that information to see which forests are stable and which are fragile, and devote resources to the places where it will do the most good.
Measuring and Managing the Complexity of the Financial System, Andrew W. Lo, MIT
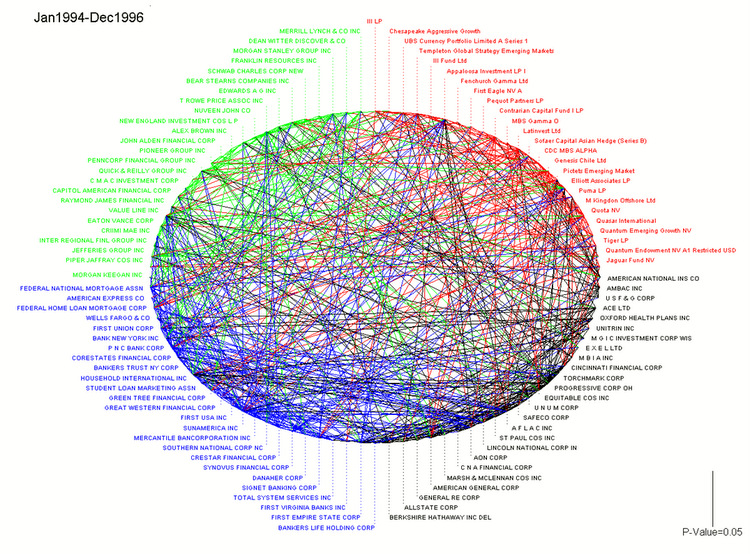 |
 |
Graphs showing significant connections between brokers, hedge funds, banks, and insurance companies, comparing 1994-1996 (left) and 2006-2008 (right) by Billio, Getmansky, Lo, and Pelizzon (Journal of Financial Economics 104, June 2012).
Lo began by noting that the world's financial system has become extremely complex and because of the technology involved, many users don't understand the consequence of their actions. He would like to institute mechanisms to make the system better and more secure but said we must realize that "Moore's Law has to contend with Murphy's Law." Even though there is a lot of data collected, there are still significant gaps which have to be filled if systemic risk is to be managed. For example, there is no data on hedge funds, which is at least partly due to privacy concerns. Lo has proposed algorithms that can provide transparency, so that needed data would be available, while still preserving privacy.
A Compressive Introduction to Compressive Sensing, Mark Davenport, Georgia Institute of Technology
When a picture is taken with a digital camera, data is first sampled to create the picture. The image is later compressed for storage or transmission. Is it possible to create the image in compressed form originally so that not as much sampling is needed? The answer is yes, using the relatively new idea of compressive sensing, which is applied to images and other signals. Davenport gave an introduction to the theory, concentrating on sparse signals. Most signals encountered in the natural world do have simple characteristics, so sparse signals are common. Davenport showed the steps in measuring the signal, which involved a good deal of linear algebra, and in one method of recovering the sparse signal after measurement, which used convex linear programming and the l1 norm. Find out more about compressive sensing in this interview with Emmanel Candès.
Sand Dollars, Echinodermata, and Radiolaria: Sculptural Forms from Hyperbolic Tessellations, George Hart, Independent Sculptor
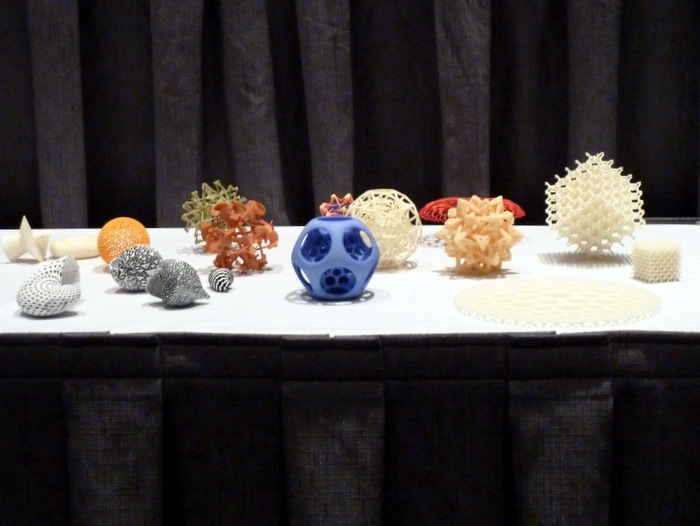 |
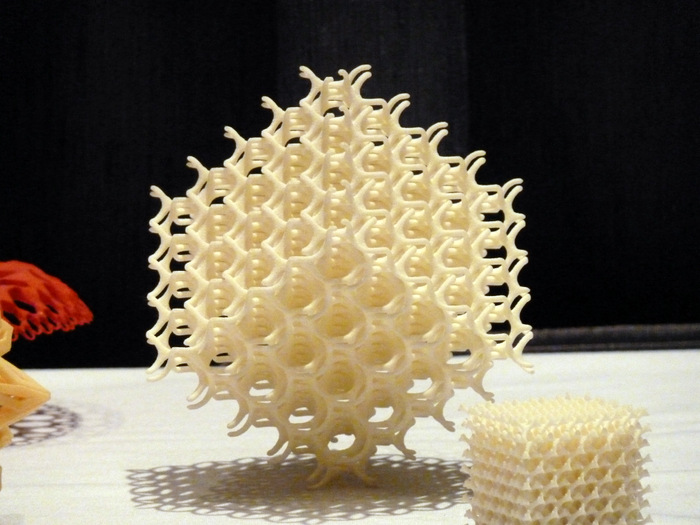 |
Hart, who is a mathematician in addition to being a sculptor, showed many of his works of art during his presentation, which was part of the symposium Artful Science. Most works he showed were on the screen, but he did bring some with him (pictured above), most of which were made with a 3D printer. He explained those creations that modeled the creatures in the title of his talk and gave the audience a look into hyperbolic geometry, especially tessellations in the plane and in space.
The 2014 AAAS annual meeting will be in Chicago, February 13-17. The AAAS website has more information.
You can also read about mathematics at previous AAAS meetings: 2012, 2011, 2010, 2009, 2008, 2007, 2006, 2005, 2004, 2003, and 2002.
Text and photos by AMS Public Awareness Officers Mike Breen and Annette Emerson.