Gold has been much admired by human societies at different times and in different places. In 2011 the price of gold (love that data) on some markets exceeded $1900 an ounce. Black gold has been a metaphor for the importance and value of oil (currently over $100 a barrel) for many years now. But could it be that it will be data that will be the really valuable commodity of the future? And if so, what does that have to do with mathematics?
April, 2012 is Mathematics Awareness Month and the theme for this year is: Mathematics, Statistics, and the Data Deluge
My goal here is to briefly discuss what is meant by the phrase data mining and what mathematical tools and ideas have been brought to bear in trying to make progress in this field. One origin for data mining is the ease of collection and volume of data that can collected, thus creating a demand for the analysis of the collected data. What is seen here is a "classic" example of how mathematics grows when problems outside of mathematics catch the attention of the mathematics community, but as has been true over and over again, mathematics that has been developed in the past, simply because of its "beauty" and intellectual appeal, is often the right tool for getting insight in the new applied setting. After giving some background about the issues, I will give examples of some of the data intensive areas that are getting lots of attention and discuss some of the ideas involving "artificial intelligence" that are at the periphery of data mining.
Data, Data, Everywhere
What is "data"? Data is a term used in a variety of ways, most commonly as "facts" or statistics in numerical form. However, sometimes the term is used to mean information that is going to be analyzed or used to make some decision. Another relatively recent "definition" of data involves the numbers, symbols, strings and tables (matrices) that are manipulated or analyzed with a computer.
Data has been with us for a long time, but the idea of using data to get insight and/or inform policy is relatively new. While geometry and algebra have roots that go back thousands of years, the mathematics of "data" is more recent, with the most dramatic progress being in the last 150 years. Part of the reason for this is that it is very time consuming for humans to do the calculations with or analysis of large data sets to obtain "insight," and this work is subject to human error. Thus, it required the ubiquitousness of digital computers for the collection and analysis of large data sets to "explode." Computers assist in both the collection of the data sets and their analysis!
To understand data in the sense of seeing patterns that are present not due to "noise" or chance measurement errors, requires an understanding of probability theory. Probability theory and statistics in many ways are subjects that go hand in hand. However, probability is an intrinsically difficult and subtle subject. While the mathematics of probability theory is now on a firm foundation, mathematical modeling with probability, using probability in subjects outside of mathematics, is very complicated. When one makes the statement that a particular physical coin C has a slight bias towards heads, so that the probability of a head is .501 while the probability of tails is .499, how does one interpret this statement? If one tosses C over and over again in a way where the physical tossing of the coin does not affect the way the coin shows up heads or tails (skilled individuals can take a 2-sided coin and by using the same very precise motion of tossing do so in way that heads will come up all the time), one will get a pattern of H's (for heads) and T's (for tails) that appear. For example, I tossed a coin 10 times and got this pattern:
TTHHHTTTTH
Now, based on this finite and short collection of tosses the relative frequency of heads is: 4/10 (4 heads out of 10) while the relative frequency of tails is 6/10 (6 tails out of 10). Now perhaps you see the difficulty that is emerging here. For any fixed number of tosses, even a very large number of tosses, the number of times that we will have a relative frequency of heads being .501 and the relative frequency of tails being .499 will be very rare (if ever). The "stabilized relative frequency" interpretation of probability is that in the long run, with more and more tosses of the coin, the relative frequencies one will get for heads and tails will be .501 and .499 respectively. These stabilized relative frequencies will be interpreted as the probability of head and tail for this coin. Unfortunately, there seems to be no way to make the intuition behind this kind of argument "rigorous." Among other things, it is not so clear what one would mean by saying the probability of there being a nuclear accident in the next 10 years at this power plant is .00000001 or the probability of its raining somewhere in Boston tomorrow will be 4/10. The modern view of probability is that it is a system using certain undefined terms subject to certain rules (axioms). The "intuitive" properties of probability emerge from this system. These rules mean that someone using a "relative frequency" view will not, in a sense, be misled. However, over the years there have evolved other approaches to "meaning" of probabilities. Clearly, for rolling dice, tossing coins, looking at the sex pattern for the birth of children, it may be reasonable to have in mind the stabilized relative frequency interpretation of probability. However, what about the chance of a nuclear power plant accident involving the meltdown of a fuel rod core over the next 10 years? There is a very limited history of such events so a stabilized relative frequency interpretation makes little sense. Even for ubiquitous statements in weather reports, what meaning should be attached to the statement that the chance (probability) of rain tomorrow is 80 percent?
As mathematicians grappled with how to assign meaning to the concept of a probability, many different "conflicting" ideas emerged. Thus, Leonard Savage (1917-1971), a prominent contributor to ideas about probability and statistics, notes:
"It is unanimously agreed that statistics depends somehow on probability. But, as to what probability is and how it is connected with statistics, there has seldom been such complete disagreement and breakdown of communication since the Tower of Babel."
(Photo of Leonard Savage)
Part of the issue is to use common language (whether in English, French, etc.) to express the different environments in which situations come up which involve "noise," "randomness," "chance," or something "unexpected." The nature of radioactive decay has a very different character from where the next tornado might hit in a particular state, or what is the chance that it will hit a particular town on a particular day.
Many interpretations of the meaning of probability have been developed. As one example, there is an approach to probability theory that involves subjective judgments that are based on the fact that people have expertise based on experience. This approach, also known as Bayesian probability (though even this term has been given several different meanings), attempts to quantify the extent or degree of belief that the person providing the probability of an event has for that event's occurring. The "probabilities" that arise from this point of view will obey the same basic rules as those derived from the formal approach to probability theory that has been developed by mathematicians. However, the methodology of drawing inferences based on these different meanings for probability can be quite different. Thus, the issue is not without modeling and practical consequences, since there are situations where one is making a decision and there may be different numbers to consider for the decisions you will have to choose from because different approaches to probability are being used. This complex subject still engages mathematicians, statisticians, and philosophers in extensive discussions!
Pioneers of probability and statistics
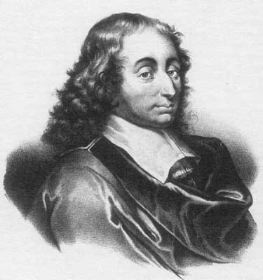
It is very rare in mathematics that important ideas come out of nowhere and have no antecedents. Many individuals from many countries have contributed to probability and statistics. Here is a small sample of such important contributors. Certainly one of the early pioneers of the relative frequency approach to probability theory was the French philosopher and mathematician Blaise Pascal (1623-1662). Pascal developed his ideas in the context of assisting with insight into the games of chance that gamblers practice.
(Portrait of Blaise Pascal)
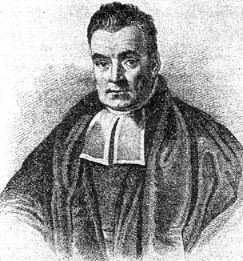
A major insight into probability theory was taken by Thomas Bayes (1702-1761). Bayes was an English minister who also did work in mathematics.
(Portrait of Thomas Bayes)
Bayes' famous result involves the notion of conditional probability for the outcomes of what one sees in the world (experiment) or are the results of some hypothetical experiments. Such outcomes are referred to as events. When one tosses a fair coin C (by which I will mean that the stabilized relative frequency of probability of head or tail is each 1/2) ten times, one can ask for the probability of the event that exactly 7 of the 10 tosses resulted in a tail, or a different event, that at least 7 or the ten tosses resulted in a head. Suppose that the probability of having a boy child or a girl child is 1/2, and births are independent of each other (which loosely speaking means that the outcome for one child does not affect the outcome for other children). We can ask: What is the probability that a couple's next two children will be girls? If an ordered string GGB means first child a girl, second child a girl, and third child a boy we can denote the required probability as: P(GG). We can also use subscripts to indicate birth order: B1, G2, G1B2 would denote the three events first child a boy, second child a girl, first child a girl and second child a boy, respectively. Now suppose that we know that the first child turned out to be a girl. We can now ask, what is the probability that both children will be girls? We are asking for the "conditional probability" of having two girls given that the first child was a girl. More generally, we can write: P (X | Y) = probability that event X occurs given that event Y occurred. We can also write P ( Y | X ) = probability of event Y given that X has occurred. It is not difficult to see on intuitive grounds (relative frequency interpretation) that provided P(Y) is not zero:

using the symbol for intersection of two sets X and Y one often sees this written:

A moment's thought should convince you that when neither P(X) nor P(Y) is zero, that P(X|Y) and P(Y|X) need not be equal.
For example, for the births question above P(G1G2|G1) is 1/2 while P(G1|G1G2) = 1. Note that P(G1G2) = 1/4 while P(G1) = 1/2.
In the "world" of working with conditional probabilities, Thomas Bayes (1702-1761) provided a useful tool in a result, published after his death, now known as Bayes' theorem. Intuitively, it provides a framework for sorting out the "relative" influence of some event on the "factors" (events) that might result in that event's happening. More specifically, suppose we have a finite list of events X1, X2,..., Xk which are mutually exclusive--only one of these can occur. Thus, the sample space, outcomes that can happen from an experiment, is the collection of the Xi's. Suppose E is some event which has non-zero probability. Now suppose we know that E has occurred for sure. We now want to compute P(Xi|E.). Bayes' theorem is a "formula" which enables one to do this computation. It gives a probability, knowing E occurred, that a particular factor Xi occurred.
Relatively early in the history of mathematics (18th century and earlier) nearly all of the people who made important contributions to mathematics were also great physicists. People like Newton (1643-1727), Euler (1707-1783), Pierre-Simon Laplace (1749-1827), Adrien-Marie Legendre (1752-1833), and Karl Friedrich Gauss (1777-1855) were not only distinguished mathematicians but also distinguished physicists. As physicists they were in part concerned with the "noise" that occurs in data--errors in measurement of physical quantities. Some aspects of statistics and probability theory have their roots in such considerations; in different ways all the individuals named above thought about such matters, including doing the mathematics that led to the development of what today would be called the "least squares method." Ideas related to the normal distribution also grew out of this work. However, as we know, statistics has been especially supportive of not only the sciences but also the social sciences. A pioneer in this direction was the Flemish (Belgian) mathematician/scientist Adolphe Quetelet (1796-1874). Quetelet took an interest in the use of the normal curve to deal with human traits and also wrote about crime using an analytical point of view. As such his work constitutes what would be called an early use of statistical ideas in sociology.
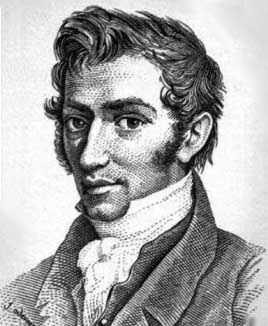
(Portrait of Adolphe Quetelet)
In more modern times a growing number of individuals have made contributions to statistics and its interface with probability theory. My purpose here is to show not only that people from many backgrounds and countries have contributed to our current richer understanding of statistics and probability but also how much of what is now known is of quite recent origin. To do proper justice to this topic would require a book-length treatment.
Karl Pearson (1857-1936) was born and died in England. He was educated at Cambridge University but spent much of his career at University College in London. Pearson became interested in using mathematical ideas to study evolution and this led him to the development of new statistical ideas and methods. It was he who in 1894 coined the term standard deviation--the commonly used term for one measure of spread, known to so many students of liberal arts statistics courses! Pearson helped develop ideas related to using statistical tests which involved employing large samples.
(Karl Pearson)
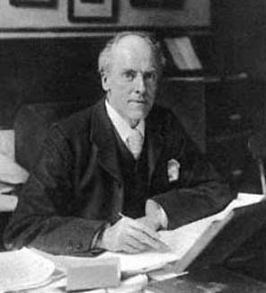
Like all of the parts of mathematics, when examined "under a microscope," statistics has had a rich and complex history with contributions from many people who thought of themselves as mathematicians but also were in many cases from other areas of intellectual endeavor. John Maynard Keynes (1883-1946) is best known for his work in economics but he wrote an important book on probability theory in 1921 after having studied, among other things, mathematics at Cambridge University. Keynes' work was looked at by Lord Russell and also came to the attention of Frank Ramsey who, in addition to his famous work in combinatorics (what is today called Ramsey's Theorem), did important work on the mathematical and philosophical foundations of probability theory. While initially Keynes' view of probability tended towards the stabilized relative frequency approach, as time went on he moved towards a more subjective--intensity of belief--system, possibly because in economics that has a natural appeal.

(Photo of John Maynard Keynes)
Ronald Fisher (1890-1962) was another British mathematician educated at Cambridge. He is known for a large variety of accomplishments in statistics. So called F-tests are named for him. Fisher also had an interest in experimental design. He worked for many years at the Agricultural Experiment Station in Rothamsted, England. There he was involved with procedures that could establish how the effects of different "treatments" of plants affected them. A treatment could be a watering regime, different type of soil, or a fertilizer regimen. Using statistical analysis the idea was to sort out the effects of different types of treatments on different types of plants, say, to increase yield of a food plant. Ironically, and sadly, at one point in their careers Fisher and Pearson were involved in a heated dispute about Fisher's statistical ideas and methods.
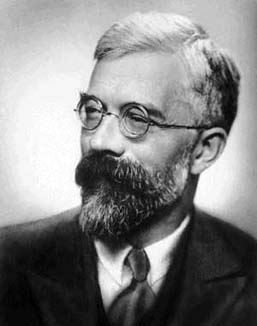
Photo of Ronald Fisher
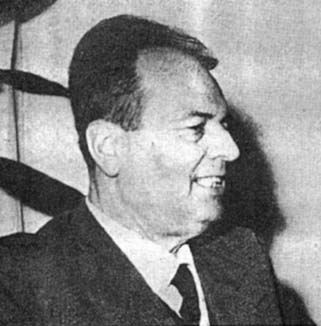
Jerzy Neyman (1894-1981) was born in Russia but ended his career in the United States. Along the way he lived in London for some time where he interacted with Egon Pearson (1895-1980), the son of Karl Pearson, who was also a statistician. In the United States, Neyman had a position at the University of California at Berkeley, where he help make the Statistics Department world famous.

Photo of Jerzy Neyman
Bruno de Finetti (1906-1985) was born in Austria but educated in Italy and died in Rome. He became known for promoting a "subjective" view of the meaning of probabilities.
(Photo of Bruno de Finetti)
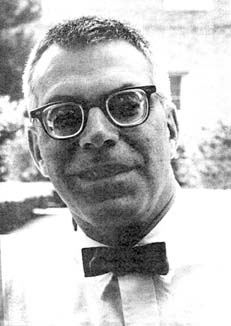
As the power of the digital computer progressed, mathematicians began to take advantage of that power to explore and draw implications from data. John Tukey (1915-2000), who coined the term "bit" for a binary digit, was a pioneer in the field of exploratory data analysis. He started out as a chemistry student, not in mathematics, but eventually earned a doctorate in mathematics from Princeton University. Tukey worked for many years for Bell Laboratories. While at Bell Labs, where he reached the rank of Associate Director, Tukey was involved with finding ways to exploit the growing power, increased memory, and greater speed of computers, to get as much information as possible from data. Bell Labs, and Tukey, helped develop innovative ways to display data sets. The human eye is exquisitely sensitive to visual patterns, so Tukey and others explored how to display data in a way to use the human visual system to get insight from the data. Tukey, together with James Cooley was also responsible for important work in signal processing via his work on the Fast Fourier Transform (1965).
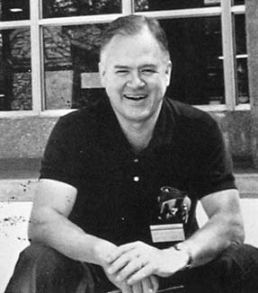
(Photo of John Tukey)
Data-intensive subjects
It is sometimes claimed that recently we are "drowning" in data. This notion has come about in part because there is so much data being generated, collected, and stored that most of us don't have the time to look at it all, no less think about the implications of the data. While in some sense all aspects of 21st century American life are becoming data driven it may be helpful to just list a few of the areas that are "data intensive."
Even before the advent of high-speed digital computers certain domains attracted the widespread collection of data. Here I look at a very brief list of such areas and in an abbreviated way deal with some of the hopes that new statistical methods can be used to get further insights into these areas.
Weather
While the mathematics behind getting better weather forecasts often depends on the solution of partial differential equations, these equations need data as input. Detailed information from different sources can be put together to obtain accurate information about local weather and more regional weather. Huge amounts of data are generated from concern and interest about the weather. This is not only an issue of whether to take one's umbrella or raincoat in the morning when one heads to work, but to assist farmers in knowing when to harvest their crops and even what crops to grow each season. When a wet season is expected, a farmer might choose to grow a different mixture of crops than what he/she would choose otherwise. Data collected in conjunction with the weather includes barometric pressure, temperature, relative humidity, wind strength and direction, rain/snow amounts, etc. The data collected as noted is used both for decision making and planning. Data is also being looked at with regard to the shrinkage of glaciers and the polar icecaps and what the implications are for these changes for countries that border the oceans.
Medical Imaging
There has been a dramatic increase in the use and kinds of medical imaging, many of these imaging breakthroughs having support from mathematics. For example, work of Johann Radon helped make possible tomographic imagery after engineering and other technologies (computer speed and storage) could be added to the ideas he provided. Medical information systems are being developed so that data such as the results of CT and MRI scans, or blood tests, can be shared by the different physicians involved in treating a patient. There is also the issue of trying to use data to help properly diagnose a person with complex symptoms.
New Medicines
The development of efficacious and safe new medicines is a high priority in which other mathematical tools are being used to understand the nature of treating diseases, especially genetic and infectious diseases. For example, mathematics is being used to try to find a treatment plan for people with different states of AIDS. Unfortunately, some drugs (antibiotics and antimalarial drugs) become less effective with time because the pathogens that cause disease evolve to be resistant to the drugs used to treat these diseases. Governmental and private organizations are always on the lookout for new ways to modify existing drugs that will either improve their efficaciousness or stay ahead of the growing resistance displayed by pathogens. Data collected from patients as well as the structural formulas of the drugs are the raw material for mathematical and statistical ideas to develop better drug treatments.
Genomics/Computational Biology/Bioinformatics
When Crick and Watson developed their famous model for inheritance it opened up a new field within both biology and mathematics and which draws heavily not only on statistics and probability but also other parts of mathematics. In a nutshell, DNA, the molecule that mediates inherited traits, can be thought of as sequences of the four letters ACGT, each of the letters an abbreviation for a specific nucleotide. While each individual has their own special genome defined via these sequences of letters, a species has a genetic makeup which distinguishes it from other species based on a model for its DNA. Species differ in their number of chromosomes and the number of genes that are on these chromosomes. Using faster and faster sequencing machines, more and more data is being generated of individual genomes and the genomes of different species. Already biologists claim to have catalogued over a million species and but there are those who claim that the number of species currently on Earth is quite a bit larger than this number. The very definition of species is partly a statistical issue. One way to tell two objects apart is to develop some distance based on a sequence of "measurements" taken on the objects. Given DNA sequences one can use various "distances" to try to measure how alike or not alike the sequences are. The new field of bioinformatics was born to develop specialized statistical tools for this environment.
Cosmology/Astronomy
Anyone, even using the naked eye, will be in awe of the number of stars they will see on a clear night at a location far from the presence of electric lights. Now, with the help of telescopes placed on mountain tops (increasingly in the Southern Hemisphere where there are fewer man-made sources of light) as well as satellites and space telescopes (notably the Hubble Telescope), gigantic amounts of data are being collected about many aspects of the heavens. Using imaging techniques and statistical ideas, astronomers are trying to get a richer insight into the nature of our Universe, locating places that might be hospitable to the development of life. This complements the work of physicists who are trying to understand the nature of time, space, and gravity.
Gambling and Investment
An unending source of data is gathered in the pursuit of interest in gambling games and investments. The NYSE (New York Stock Exchange) generates huge amounts of data on a daily basis. Hundreds of stocks (and on other exchanges, bonds) are tracked over shorter and shorter time spans to try to divine patterns that will give one insight into promoting one's economic interest as an investor buying on these exchanges. Many persons involved with stocks are what are known as technical analysts. These individuals study trends in the price of stocks (often using complex statistical tools) together with other information in the hope of making profitable investments. Emerging ideas in financial mathematics together with statistics are being used to help individual countries control their business cycles with the minimum disruption to the countries involved and to help understand the nature of world markets.
Particle Physics
For many years both in the United States and Europe, hardware to accelerate atomic particles to higher and higher speeds has been constructed. Examples of such machines are the Fermilab Tevatron and CERN's Large Hadron Collider. The purpose of these machines has been to probe physicists' insights into the nature of matter and the particles that make up matter. While what is called the Standard Model has been highly successful in explaining most of what is currently known about matter, there are still many mysteries that physicists are concerned about. One of these mysteries is whether or not the Higgs Boson exists. Experiments done with various particle accelerators have yet to find this particle though the energy levels at which it can be found have been narrowed. Every time these accelerators are used for an experiment, huge amounts of data are examined and often large numbers of images are also generated. Data mining provides techniques that help examine this data to look for both specific "particle decays" that would represent something unexpected as well as finding data that confirms and solidifies our understanding of phenomena we think we understand.
Traffic Information
Getting to and from work or to concerts, plays and sports events in a timely way looms high with urban and suburban area dwellers. Nothing is more frustrating than arriving late because of being caught in traffic. Many systems are now being developed to deploy sensors and cameras to help monitor traffic flow and try to use data from these systems to give drivers real-time suggestions for planning routes so as to minimize travel time. Data from these devices is also useful in knowing how many toll booths to have open on a bridge and to decide what pattern of lanes to use on a bridge where some of the lanes can be used in either direction,
Education
Data collected as part of monitoring what is happening in the field of education is of growing importance. Individual schools, whether they operate in the K-12, college, graduate school, or professional school arena are interested in the demographics and the performance of their students. Governments at different levels are trying to plan to have enough capacity in the public school system and to determine if the schools are serving societal needs well.
Email and the Web
Many individuals spend lots of time with email and additional time with looking at things on the Web. These two domains generate huge amounts of data that can be looked at from an individual point of view or from a commercial point of view. Many companies now are interested in getting information about the way either individuals or groups of people (often accessed via what zip code the person lives in) as a way to try to tailor browser searches results. Companies will often pay for a prominent place on the results of a Web search because past behavior of that individual suggests that an ad associated with a particular search term might result in a sale to the company. Sociologists, economists, and other scholars also have an interest in being able to study information that might be gleaned from data associated with email and the Web.<
Tools of data mining
The scaffolding that surrounds data mining is the mathematics of statistics, enriched with ideas from artificial intelligence and computational learning theory.
Artificial intelligence is a field that has attracted the interest of mathematicians, computer scientists and philosophers. Loosely speaking the field refers to having human beings design and program computers in a way that their performance resembles what humans do when they are "creative" or "thinking."
Historically, artificial intelligence (AI) set itself the goal of having computers play prestigious games that humans associated with higher levels of thinking skills, games that don't involve chance, like checkers, chess, and Go. While early on in the history of AI there was the belief that computers could be "armed" with principles of good play that would enable them to play chess, for example, well, these approaches had limited success. As computers got faster and faster with more and more memory, AI began to exploit these features of computers. Thus, for a particular position of a chess game it became possible to have the computer look at all possible moves the computer could make, all possible moves the opponent could make to all these moves, for many levels of move and response. Using this "brute force" approach together with some "position evaluators" which enable certain moves to be eliminated as being not likely to lead to any success, a computer system, IBM's Deep Blue, beat a world champion chess player.
More recently, IBM also designed a computer system called Watson that beat the "best" human opponents at Jeopardy, a game which involves a complex mixture of factual recall in an environment of linguistic playfulness. A contestant gets to choose a topic with a particular number of points where the difficulty of the question changes with the point value assigned. From time to time the contestant may pick a question, which if answered, correctly will double the amount of money received. Sometimes when a question is chosen in a particular category the contestant gets to pick what part of the current earning he/she/it has to "wager" on getting the right answer. Thus, there is a "Final Jeopardy" round where one can try to overtake one's opponent by betting a large part of one's current winnings in hopes of overtaking an opponent if one gives a correct response. On February 14-16, 2011 in a special series of TV shows that was screened in prime time, the IBM "system" known as Watson beat two very impressive human opponents, despite a few strange bits of "behavior" on Watson's part in answering questions. Watson's buzzer skills (ringing in when it was ready to answer) were very impressive but it tended to perform less well when the clues that it had to answer a question were very short. Listen to one of the IBM researchers talk about his work on Watson.
Computational learning theory is involved with finding algorithmic approaches to having machines improve their performance with respect to a specific goal. For example, one of the recent nuisances for people addicted to their email is the growth of spam. Spam consists of messages sent via email that one has no interest in receiving. Software has been developed that screens incoming email and routes message that are probably spam (some systems just discard such messages) to a location where if you do not look at them within a certain time frame they will be discarded. Human users can typically set parameters of the spam filter so that it will be more likely not to discard messages that one really wishes to see. Using ideas from Bayesian statistics one can design spam filters that get increasingly successful even when the owner of the mailbox doesn't help clarify which decisions on the part of the filter are not the desired ones.
One way of making sense of data is to find mathematical models that explain the data one finds and to use the power of mathematics to organize what one sees. An example of this is the use of the mean and standard deviation to model the central tendency and the variability of data. Thus, whether the data is collected from a physics experiment, a psychologist's experiment, or professor of English looking at the lengths of words in Shakespeare's plays, one can put the same mathematical tool to work. Another example of the organizing power of mathematics was when the idea of a probability density function and a probability distribution function were developed. This made it possible, say, to talk about data which followed a pattern of the normal distribution versus data that followed some other pattern. However, the volume of data being produced and the range of areas where there is hope that the data can be put to applicable use are a challenge to us all. Mathematicians, statisticians, and computer scientists are trying to respond to this challenge.
Enjoy Mathematics Awareness Month and use it as an opportunity to find out more about statistics, probability and related tools for understanding data!
References:
Bergeron, B., Bioinformatics Computing, Prentice-Hall, NY, 2002.
Berkin, P., A survey on PageRank computing, Internet Math., 2 (2005) 73-120.
Berry, M. (ed.), Computational Information Retrieval, SIAM, Philadelphia, 2001.
Berry, M and M. Browne, Understanding Search Engines. Mathematical Modeling and Text Retrieval, 2nd. ed., SIAM, Philadelphia, 2005.
Cios, K. and W. Pedrycz, R. Swiniarski, Data Mining, Kluwer, Boston, 1998.
Dale, A., Most Honorable Remembrance: The Life and Work of Thomas Bayes, Springer, New York, 2003.
Duda, R. and P. Hart, D. Storck, Pattern Classification, 2nd. ed., Wiley-Interscience, New York. 2001.
Eldén, L., Matrix Methods in Data Mining and Pattern Recognition, SIAM, Philadelphia, 2007.
Hacking, I., The Emergence of Probability: A Philosophical Study of Early Ideas about Probability, Induction and Statistical Inference
Hald, A. A History of Probability and Statistics and Their Applications Before 1750, Wiley, New York, 1990.
Han, J. and M. Kamber, Data Mining: Concepts and Techniques, Morgan Kaufmann, San Francisco, 2001.
Hand, D. and H. Mannila, P. Smyth, Principles of Data Mining, MIT Press, Cambridge, MA, 2001.
Hastie, T. and R. Tibshirani, and J. Friedman, The Elements of Statistical Learning. Data Mining, Inference and Prediction, Springer, NY, 2001.
Hegland, M., Data mining techniques, Acta Numer., 10 (2001) 313-355.
Klein, J., Statistical Visions in Time: A History of Time Series Analysis, 1662-1938, Cambridge U. Press, New York, 2006.
Stumpf, M and M. Porter, Critical truths about power laws, Science 335 (2012) 665-666/
Porter, T., The Rise of Statistical Thinking, 1820-1900, Princeton U. Press, Princeton, 1986.
Ross, S. A First Course in Probability, 7th edition, Prentice-Hall, Upper Saddle River, 2006.
Ross, S., Introduction to Probability Models, 4th ed., Academic Press, New York, 1989.
Salsburg, D., The Lady Testing Tea: How Statistics Revolutionized Science in the Twentieth Century,
Savage, L., Foundation of Statistics, Wiley, New York, 1954.
Stigler, S., The History of Statistics, Harvard University Press, Cambridge, 1986.
Stigler, S., Statistics on the Table: The History of Statistical Concepts and Methods, Harvard U. Press, Cambridge, 1999.
Todhunter, I., History of the Mathematical Theory of Probability from Pascal to Laplace, 1865.
Witten, I. and E. Frank, Data Mining. Practical Machine Learning Tools and Techniques with Java Implementations, Morgan Kaufmann, San Francisco, 2000.
Wright, D., Ten statisticians and their impacts for psychologists, Perspectives on Psychological Science, 4 (2009) 587-597.
Those who can access JSTOR can find some of the papers mentioned above there. For those with access, the American Mathematical Society's MathSciNet can be used to get additional bibliographic information and reviews of some of these materials. Some of the items above can be accessed via the ACM Portal, which also provides bibliographic services.

 Joseph Malkevitch