The Process of Electing a President
Posted April 2008.
The issue of how to equalize the influence of people in different parts of the country in the selection of party candidates is a complex one, which scholars in many disciplines are addressing, using mathematical methods...
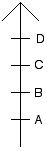
Joseph Malkevitch
York College (CUNY)
malkevitch at york.cuny.edu
Every four years Americans elect a president. Voting and elections are essential for an effective democracy. The people who make up a society get to choose their representatives to govern them and these representatives vote on or administer the laws that affect citizen quality of life on a daily basis. This year, Mathematics Awareness Month calls attention to the role that mathematics and statistics have in understanding the phenomena of voting and elections.
The process by which America's president is elected is amazingly complex. Almost as soon as a new president is elected, the "campaign" for the next election begins. Candidates position themselves for support, attempt to raise money for their campaigns, and carry out these campaigns over an extensive period of time. There are caucuses, primaries, debates, and many other steps to wind up on the ballot for being chosen to be president.
Here are the results of three Presidential elections, showing only the results for major parties and other candidates getting a significant number of votes.
2000
|
George W. Bush
|
50,456,062
|
|
Albert Gore, Jr.
|
50,996,582
|
|
Ralph Nader
|
2,858,843
|
1992
|
William J. Clinton
|
44,909,326
|
|
George Bush
|
39,103,882
|
|
H. Ross Perot
|
19,742,240
|
1968
|
Richard M. Nixon
|
31,785,148
|
|
Hubert H. Humphrey
|
31,274,503
|
|
George Wallace
|
9,906,473
|
One interesting question is whether or not these numbers are as precise as they appear when reported because most of us, if asked to count many seemingly well-determined numbers, would not get the exact right answer. (Usually this would be because to carry out any large count takes sufficiently long that our attention flags and we would probably make some error.)
The issue of accuracy in vote counts was brought to the fore by the now famous "hanging chads" issues involved in counting votes in Florida for the 2000 presidential election. If you look at different information sources, you will find differing totals for the number of votes that Bush and Gore got in the 2000 election. Whereas many people think in terms of tabulating paper ballots because often day-to-day votes are done with these, the issue of how to vote online, or using electronic/mechanical voting machines, raises many questions about the accuracy of vote counts. Mathematicians and computer scientists are looking into issues related to the security of voting and the accuracy of vote counts. In particular, suppose we have partial results from an election and the accuracy of vote for some specific districts of known size is available, can we determine if the outcome of the election might be affected by the results of these disputed votes? Noteworthy here is the fact that in 2000 the candidate who had the largest popular vote did not become president. Since ballots for president only allow a voter to vote for one candidate, it is not easy to know the consequences of having the election between only the two top vote-getters instead of the many candidates who typically appear on a presidential ballot. Furthermore, we can not be sure if the candidate a voter voted for is that voter's "favorite" candidate. For example, in the 2000 election it is possible that some voters for Gore or Bush would have preferred Nader but voted for the person they did because they felt that, given the way the votes were going to be counted (e.g. plurality voting), they did not want to "throw away" their vote and, hence, voted for someone other than their first choice.
The Electoral College
The reason Gore did not win the election in 2000 is that the president is not elected on the basis of the popular vote but on the vote in the Electoral College. The essence (there are technical details) of the way that the Electoral College works is that each of the 50 states casts a block of votes which represents the total number of Senators (always 2) and the number of members that the state has in the House of Representatives. In the Electoral College the District of Columbia also casts 3 votes. Thus, 100 + 435 + 3 = 538 votes are available and to be elected president (with the vice presidential choice now tied to that of the president) requires 270 votes.
In the election of 1988, George Bush received 426 votes (79.2%) in the Electoral College and Michael Dukakis received 111 (20.6%). From this data you might think that Bush won by a "landslide." However, in the popular vote Bush got 48,866,097 (53.4% ) and Dukakis got 41,908,074 (45.6%), showing that the election was much closer than what is indicated by the popular vote.
The difference between the Electoral College vote and the popular vote in elections such as the one between Bush and Dukakis indicates that the way candidates attempt to get elected president depends not merely on how many votes the candidate gets but in which states those votes are gotten. This leads to decisions by candidates on how they spend their time campaigning for the presidency and the way they spend money to get elected. Mathematicians have tried to get insight into the Electoral College, and other voting bodies where blocks of votes are cast by studying weighted voting. Weighted voting is not only used in the Electoral College but also in many aspects of running the European Union to adjust for the fact that different countries of the EU have different population sizes and economic power. Some people feel that eliminating the Electoral College and electing the president using the popular vote would be more democratic. Some argue that if there were no Electoral College and the country had a "better" voting system, instead of having only two major parties in the United States there might be more parties and, hence, more voter choices. Others say that, as observed above, close votes in the popular vote are often translated into big victories in the Electoral College and that this gives added stability to American democracy.
There is another layer of complication in becoming the president, getting the endorsement of one of the two major parties (Democratic or Republican). The candidate selected to run for president by the major parties is done through a complex system of caucuses and primaries. A good example of this is the concern during the 2008 election that relatively small states were having a disproportional effect on who was selected as a candidate because these small states had their primaries early compared with larger states. This resulted in the decision of Michigan and Florida to reschedule their primaries to earlier than in the past. However, the Democratic Party decided that it would not allow the delegates elected in these rescheduled primaries to be "seated" at the party convention. The issue of how to equalize the influence of people in different parts of the country in the selection of party candidates is a complex one, which scholars in many disciplines are addressing, using mathematical methods.
Mathematical insights into elections and voting
Not only do Americans vote for president but we also vote for the representatives who create the laws which form the basis of our daily lives. These representatives use votes to create these laws. Elections and voting behavior are ingrained in democracies. Votes can be taken for what speaker should be chosen for a high school graduate ceremony, what should be served at the union picnic, what athlete should win best pitcher of the year award and what movie actress should be the Academy Award winner for best supporting actress.
Elections and voting are perhaps the traditional domain of political science. Yet, it is becoming increasingly clear that mathematicians and statisticians have many insights into how to design and deliver voting systems and the tradeoffs between adopting different voting systems.
Voting and elections take place in a very complex environment. When mathematics and statistics are applied in such situations, one makes simplifying assumptions about the situation studied--a process called mathematical modeling, being an attempt to get insight into what is going on.
A voting system has:
* voters (these are people, countries, etc.) that are making choices
* alternatives (these are choices that are available to selected or ranked)
* how the alternatives are to be dealt with (e.g. are we selecting one winner, three winners, or producing a "ranking' of the alternatives from most preferred, second favorite, ...., least preferred)
* ballots (these are ways for the voters to express their opinions about the alternatives which are available; the voters must be instructed how the alternatives are to be dealt with.)
* decision method (these are methods for taking the ballots produced by the voters and finding a winner, set of winners (perhaps the election is to select a group of committee members), or ranking, for the group).
Each of these components of an election system carry a variety of complexities. For example, who should be allowed to vote in an election? Only men, only people who own property, only people over 18 who have not committed felonies? As part of an electoral system one has to decide questions of this kind, and the fact is that as recently as 100 years ago women did not have the right to vote in national federal elections. The 19th Amendment to the US Constitution, ratified in 1920, gave women the right to vote. Similarly, questions about what alternatives there should be available can be complicated. To get on the ballot so that voters can have the potential to vote for you requires a complex system of getting signatures so that ballots aren't cluttered with frivolous candidates or with those who have no chance of being elected.
Ballots
In what follows, for simplicity, we will consider voting situations where a single winner is to be selected or a ranking must be constructed. (In "voting" for whom to invite as a college graduation speaker one might want to rank the candidates, since the highest-ranked choice might not be able to attend on the required day.) Now, from a mathematical point of view things get rather more interesting when one considers the ballot given to a voter. The ballot is a way for voters to express their preference for alternatives.
Anyone who has voted is familiar with the standard ballot: A list of alternatives is provided (and sometimes the opportunity to write in additional choices) and the voter must select one of the alternatives. The presidential elections noted at the start of this article indicate why some people are unhappy with the use of the standard ballot and the voting systems that have been implemented using it. When there are more than two serious and well-known candidates, one often gets results which some may feel do not express "the will of the people."
Imagine you are faced with expressing your feelings about having pizza (P), salads (S), or hot dogs and burgers (B) at the company picnic. For convenience denote the three choices P, S, and B. You may be content to merely say you want S on a standard ballot but you may feel happier if you could say that you prefer salad to the other choices, but that your second choice would B and then P. You might, in fact, be allergic to pizza, a somewhat different relationship with regard to an alternative than when people say they are allergic to a candidate running for president, or say they have never heard of one of the candidates.
Considerations of this kind have created an interest in many kinds of ballots, many of them being seriously looked at only very recently. Here is a brief account of some of these fascinating ideas.
Among the earliest suggestions was that voters produce an ordinal or rank ballot where for each pair of candidates X and Y, voters specify whether or not they prefer X to Y, Y to X, or perhaps even indifference between the two. There are various conventions that can be used to display such preferences, but I like the notation popularized by Duncan Black, a pioneer in using mathematically based ideas in understanding voting and decision-making phenomena. Black's idea is to have an upwardly pointing arrow, with higher-ranked choices towards the top. When there are two alternatives to rate we have the three possibilities shown (Figure 1):
 (Figure 1)
Notice that as the number of alternatives to choose from grows, the number of potential ballots that can be cast by a single voter grows rapidly. If we have three alternatives to choose from and there is no indifference, voters can express themselves using 6 different ballots, while if indifference is allowed, then voters can express themselves with 13 different ballots. Without indifference, the number of ballots for n candidates would be n!. There is a serious concern whether or not voters are capable of producing such ballots for many more than 4 alternatives. This leads to the question: If a ballot of this kind is used, should a voter be forced to produce a ballot involving all the candidates in order to have the ballot count or can the voter truncate the ballot? In this context, truncation means that although, say, there are 6 candidates to choose from, the voter only chooses to show 3 candidates (with strict or indifference preference) in casting her ballot.
If a voter prefers X to Y, is there some way to express the strength of this preference rather than just to indicate that X is preferred to Y? This concern gives rise to the idea of a cardinal ballot, where intensity of preference can be indicated. For simplicity suppose there are three candidates X, Y, and Z and one wants to allow a voter to express intensity of feeling concerning the candidates. One approach to doing this would be to give each voter a fixed number of points say 100 points, and to require that the voter use all of these 100 points, and distribute them among the three candidates as the voter saw fit. For example, if one voter gives X 49 points, Y 48 points, and Z 3 points, while another voter gives X 35 points, Y 34 points and Z 31, points then the two voters would have the same ordinal ballot but different cardinal ballots. There are those who, however, on various grounds question whether or not one can conclude from these numbers how much more Y is preferred to Z by these two voters.
An entirely different way to have a cardinal ballot is pick a number for the points that can be assigned (often, 0 to 100) and assign a number from 0 to 100 for each of the candidates. Thus, the first voter might assign X 100 points, Y 99 points and Z 33 points while the other voter would give X 9 points, Y 8 points and Z 7 points. Again, the ordinal ballots associated with these two assignments would be the same. The exact meaning of these points is unclear; there are questions about whether points have different meanings to differ people. After all, $20 found in the street will mean something different to a homeless person than $20 to a millionaire, though it is the same $20 bill. This type of ballot has been associated with a voting method known as range voting.
Beyond ordinal and cardinal ballots of different kinds here, in brief, are some other ideas:
a. approval ballot: vote for all of the alternatives you are willing to have "serve."
Note: In the 1970's at approximately the same time several people began to discuss and/or promote the use of a new type of ballot and an allied system of deciding an election. These individuals, Guy Ottewell, Robert J. Weber, Steven Brams, and Peter Fishburn hit on the idea of having a ballot where, though there was a single alternative to be chosen, one should have a ballot where one could vote for as many or few of the alternatives being considered. For example, if a club was trying to choose between pizza (P), chicken (C), burgers (B), fish (F), and salads (S), a voter could cast a ballot for C and F.
b. yes-no ballot: vote yes or no for each alternative
c. hybrid ballots: divide alternatives into two sets, the first set which you provide information about because you have knowledge about them, while for the other set you have no knowledge. After indicating this division of the candidates into two groups, one can rank or approve the candidates in the group you are familiar with.
The approval ballot is especially interesting because the mathematically sophisticated political scientist Steven Brams has been successful in promoting the use of approval voting in actual recent elections.
 (Photo courtesy of Steven Brams)
Brams's success has encouraged other reformers to try to lobby for changes in the current electoral system in the US. Brams (sometimes in collaboration with others) has also produced a large number of interesting "paradoxical" examples related to voting theory and the interface of voting and game theory. He has produced many books that explore fascinating interfaces of mathematics with voting and elections and more generally with fairness questions.
Decision methods
After picking a ballot one needs to look for good methods to decide on the winner based on the type of ballot chosen. Again, for simplicity, we will consider elections where there are ordinal (rank) ballots but each voter ranks all of the candidates, with no indifference between two or more candidates. If there are only two alternatives, the situation is straightforward. One votes for that alternative of the two which one likes most, and the decision system is to declare the winner to be the person who gets the largest number of votes. (The role of how to break ties in elections is an important topic. For simplicity in the discussion here I will assume (and use examples) where no ties occur. This is a reasonable assumption in elections where there are large numbers of voters.) When there are two alternatives, the person (or alternative) who gets the larger number of votes will also have a majority. However, as soon as we allow more than 2 alternatives, the usual ballot can result in no candidate getting a majority (as happened in the presidential elections above). The usual decision method in this case is to use plurality voting: the candidate who gets the largest number of votes is the winner.
As soon as one uses ranked ballots, there are many methods that have been suggested for deciding elections. Although the election below is not the smallest example of this kind, I will use it to illustrate some of the points about election decision methods which have emerged in the mathematical study of elections.
When people see the additional information that rankings seem to provide about the subtle ways that voters view the candidates, they take for granted that these ballots by themselves will command the selection of the "best," "fairest," or most "desirable" candidate. However, it turns out that the winner of an election, given a collection of ballots of this kind depends on the method chosen to decide the winner. After one has lived with reality for a while this does not seem very surprising but it invariably surprises people the first time they see it, because of our faith that it is the will of the people that gets us to the right choice for society.
Consider this election:
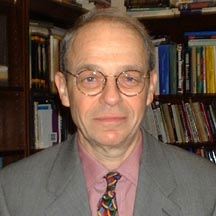
 (Figure 2: An election involving 55 voters)
This election has 5 candidates and there are 55 voters. Before reading further you may wish to decide who you think should win this election if only a single winner was to be chosen. Who is the people's choice here?
If one uses the plurality method, the winner will be A with 18/55 = 32.7 percent of the total votes. Is there a "better" method? The trouble with the word "better" is that one needs a scale to compare different methods and there is rarely an agreed upon scale for how to compare controversial issues. Typically, if one has a system and changes it, some people benefit by the change and some people lose. In elections with many candidates, there has always been concern that the splitting of the votes among the candidates might result in some person's "squeaking" by and becoming elected who really did not command broad support. One approach to remedying this is to hold a run-off election of some kind where there is no person who gets a majority of the total votes cast. Run-off elections present several problems:
a. They cost extra money to run and often many fewer people vote in the run-off than in the first election
b. There are many variants of how to conduct run-offs.
One advantage of the ordinal ballot is that it allows one to conduct run-offs without having the voters return to the polls. Note, however, when run-off elections are conducted after the original election, it is very likely that at least some of the voters will have changed preferences regarding the candidates during the ensuing period. However, with the preferences shown in Figure 2 we can conduct run-off-like elections without having the voters return to the polls.
Over the centuries, and it has indeed been centuries over which clever ideas about ways to conduct elections have been proposed, many ingenious and appealing systems of conducting elections have been put forward. Typically, these methods come with "explanations" of why they are worthwhile, superior, fairer, or more democratic than prior methods. Here we call attention to the fact that the feeling that voters have that democracy grows out of the very fact that voters freely go to the polls and have their votes counted based on the ballots cast, is naive. To see this we merely need look at a sample of 5 methods which are but a tiny fraction of the many reasonable and appealing methods that have been put forward that can be used with ordinal ballots. Here, with brief descriptions we consider: plurality, run-off, sequential run-off, Borda Count and Condorcet.
a. (Plurality) The candidate who gets the largest number of first-place votes is the winner.
b. (Run-off) If no candidate gets a majority of the votes cast, eliminate all of the candidates except for the two candidates who got the largest number of first-place votes.
c. (Sequential run-off) If no candidate gets a majority, eliminate the candidate who got the fewest first-place votes. Continue in that manner, each time eliminating the person who got the fewest first-place votes, until two candidates remain. The winner of this election wins the election.
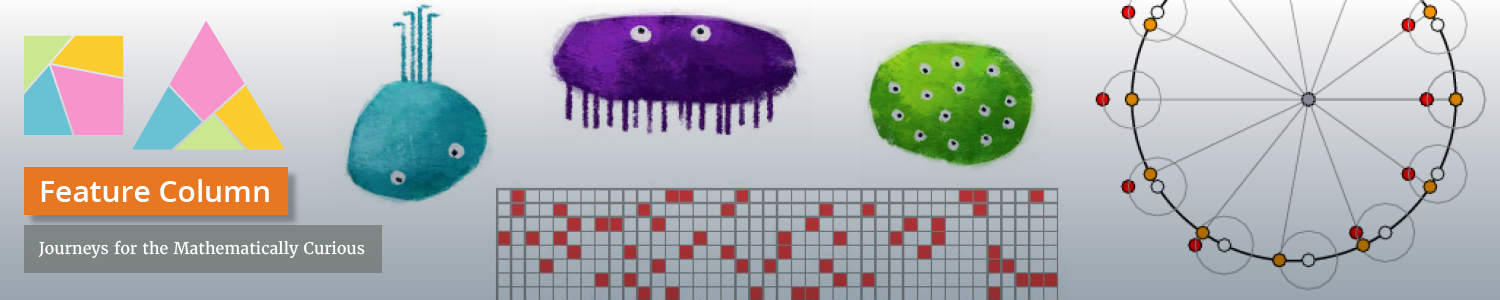
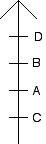
d. (Borda Count) We give points to candidates depending on how they are ranked on a voter's ballot. The number of votes that a candidate X receives from a particular voters ballot is the number of candidates below X on the ballot.
Thus, for the ballot shown below (Figure 3):
 (Figure 3)
candidate D gets 3 points, candidate C gets two points, candidate B gets 1 point and candidate A gets 0 points. If 7 voters vote for this ballot, then the number of points that, for example, candidate C would get would be 7 times 2 or 14 points.
e. (Condorcet) If there is a candidate who can beat all of the other candidates in a two-way race, that candidate is elected. (By the-two way race between candidates X and Y, I mean that we see if more voters prefer X to Y or the other way around.)
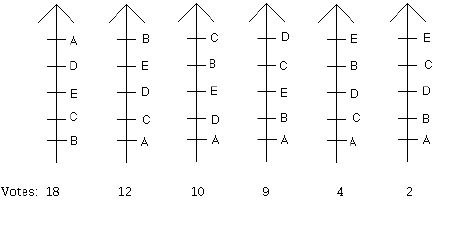
We can use a little combinatorics to see how many two-way races there are when there are 5 candidates as in the election above. This involves finding the number of combinations of selecting 2 things from 5, where the order of the selection is not relevant. This number is computed using the well-known binomial coefficients. Here, the number of unordered ways to select 2 things from 5 is 10, so there are 10 two way races to consider when there are 5 candidates. We can record the information about the two-way races in a digraph (directed graph) such as that shown in Figure 4. Digraphs of this kind are known as tournament digraphs, since they can be interpreted as showing which teams beat each other in a sports tournament. For the election in Figure 2, in the two-way race between C and B, we see that C beats B. We can indicate this by drawing an arrow from C to B in the diagram (Figure 4) which represents the two-way races. We can also enter the number of voters who prefer C to B (39) in the row labeled C and the column labeled B, and the number of voters who preferred B to C (16) in row B and column C. The other arrows in Figure 4 and numbers in Table 1 are put in place in a similar way.
 Figure 4
| |
A
|
B |
C |
D |
E |
| A |
- |
18 |
18 |
18 |
18 |
| B |
37 |
- |
16 |
26 |
22 |
| C |
37 |
39 |
- |
12 |
19 |
| D |
37 |
29 |
43 |
- |
27 |
| E |
37 |
33 |
36 |
28 |
- |
(Table 1: Entries in row X, column Y indicate the number of voters who prefer X to Y)
Compute the row sums of the numbers in Table 1. Do you recognize these numbers? They turn out to be the Borda Count values for the election!
For example, the Borda Count for candidate B is shown below:
B's Borda Count = (0)(18) + 4(12) + 3 (10) + 1(9) + 3(2) + 1(2) = 101
which is the row sum in the second row!
In describing Condorcet's method I was careful to say that one should elect the candidate who can beat every other candidate in a two-way race, providing such a candidate exists. It comes as a surprise that there are elections where there is no Condorcet winner. Generally, if A is heavier than B and B is heavier than C, then A is heavier that C. Being heavier is what mathematicians call a transitive relationship; many of the relationships we tend to be familiar with in real life and mathematics are transitive. However, winning two-way races based on ordinal ballots violates transitivity, as shown by the following example (Figure 5).
 (Figure 5)
Check for yourself that A beats D in a two-way race, D beats B in a two-way race, B beats C in a two-way race, and yet, C beats A in a two-way race! This phenomenon is known as the "Condorcet paradox." If the winner of this election is obtained by a sequence of two-way votes until one candidate emerges as a winner, it follows that depending on the order in which the votes are taken, any of the alternatives can emerge as the winner. Political scientists have examples that this phenomenon probably has actually occurred in voting bodies such as the United States House of Representatives.
Thus, if there is no Condorcet winner, supports of "Condorcet ideas" need a way of choosing a winner in this case. There are many ways of doing this. For example, Duncan Black suggested that if there is no Condorcet winner, the Borda Count should be used to pick a winner for the election.
So, who do you think "deserves" to be the winner of this election, and who do you think is the winner using these 5 different methods? Are you surprised to learn that the 5 different methods result in 5 different winners?
The plurality winner is A, the run-off winner is B, the sequential run-off winner is C, the Borda Count winner is D, and the Condorcet winner is E. Thus, it is the choice of how to count ballots together with the voters ballots that decides the winner.
Several of the methods used to decide elections use relatively basic arithmetic, hand in hand with other relatively elementary mathematical tools. However, it turns out that many insights can be obtained using mathematical methods that were developed for very different questions than social choice theory and the theory of elections. Examples of this can be found in the work of Donald Saari and Gil Kalai. Saari in particular has helped illuminate the issues related to the Condorcet paradox and has obtained dramatic insights into voting based on dynamical systems, a branch of mathematics more often used to understand orbit calculations for planets and space vehicle problems than problems about elections. Saari has also sought to show that there are situations where small changes in the ballots cast can have very big changes in the way the candidates are ranked by some methods.
 (Photo of Donald Saari. Courtesy of Donald and Lillian Saari)
Axiomatic approaches to fairness
If different decision methods for deciding elections, all of which have certain reasonable features in their favor, can lead to different winners, which method should be used in practice? A dramatic breakthrough in how to think about fairness questions was achieved by the mathematically trained economist Kenneth Arrow. Eventually, Arrow went on the win the Nobel Memorial Prize in Economics for his path-finding work. Arrow's basic insight was to inquire about what fairness properties a good election method should obey rather than look at individual methods and study what nice features they had.
 (Photo of Kenneth Arrow. Courtesy of Kenneth Arrow)
Using surprisingly elementary mathematics, Arrow was able to prove that if one is choosing a ranking where there are three or more alternatives there was no election decision method which obeyed all of a short reasonable list of fairness conditions! Following Arrow's pioneering work there are now more and more fairness conditions that are being put forward and there are attempts to see which election methods meet which fairness rules. The gold standard in this area is to find a set of conditions which are only satisfied by a particular decision method M. When one gets successful characterizations (e.g. a decision method must be method X if and only if it obeys the following list of axioms or fairness rules, then it becomes possible to see the tradeoffs when one switches between two different methods for which characterizations exist.
Many people think that the meaning of Arrow's Theorem is that it does not matter what election decision method we use, since there is no perfect method. Rather, the significance of Arrow's work is that it gives one a framework for attempting to compare and contrast different methods so one can understand what properties each method satisfies and what properties it does not. There are so many desirable fairness rules (when there are at least three candidates), that no method can satisfy them all. By adopting the axiomatic point of view, one sees clearly what faults and strengths different methods have.
You may be curious what got an economist interested in "voting." In economics, it is often necessary for planners to make decisions as to which of various economic policies to carry out. Sometimes this framework of decision making is called collective decision making but it really raises the same issues as elections and voting because one has people trying to choose between various alternatives (perhaps ways to run the economy) for the benefit of a group. Thus, one is looking for a social choice depending on the choices that individuals make. Many people view Kenneth Arrow as the "father" of social choice theory for his seminal work on collective decision making.
Manipulation of voting systems
Ideally one would like voting methods to have the property that if the voters know in advance what the method will be to count the ballots as well as information about how other voters might or will vote, the voters will be sincere in how they vote. Sincere means that the way the voter fills out his or her ballot only depends on his/her views about the alternatives. The voter does not take into account trying to get a better outcome (e.g. higher-ranked alternative) by altering his/her ballot based on information not related to the candidates themselves.
Suppose that a voter knows that the Borda count is to be used to decide an election. If the voter's sincere ballot is:
the voter realizes that this will contribute 3 points to D and 2 points to C in the election. These 2 points may cause C to win the election and D to lose the election. However, if the voter casts his ballot as below:
D will still get 4 points but now C will get no points. D might now win! This example shows the relative ease with which a voter might be tempted to cast an insincere vote if the Borda Count is being used.
There are many practical and theoretical consequences to the voting process that are related to the information available to voters, especially in a country such as the United States that stretches across many time zones (Maine to Hawaii). If voters in Hawaii (a state with a small population) or California (which has the largest population of any US state) are aware of the results of exit polls on the US East Coast how will this affect their attitude toward voting in a presidential election? This information might under some circumstances cause voters to cast their votes insincerely or otherwise alter their voting behavior. (A voter might decide to stay home rather than vote because the voter thinks the situation for the candidate that voter supports is hopeless.)
In light of these considerations it is natural to ask the question as to what decision methods for counting votes in elections do not allow for manipulation of the voting process. The answer to this type of question was pioneered independently by Allan Gibbard and Mark Satterthwaite. In very general terms what Gibbard and Satterthwiate showed was that in voting situations where there are three or more alternatives, under very weak assumptions the only decision method that is not manipulatable is dictatorship! (Dictatorship is the election rule where whatever other voters may submit as a ballot, the outcome always coincides with one person's ballot, the dictator's ballot.) This result, no less important or profound than Arrow's Theorem, has very important consequences for voting and voting behavior. It raises important questions about the consequences of having very detailed information available to other voters, and the consequences of choosing methods for which it is easy to use information about other voters' behavior to change the results of an election where all voters are sincere in their votes. Interestingly, Gibbard majored in mathematics as an undergraduate and later studied philosophy with John Rawls, who wrote extensively on fairness questions. He now teaches in a philosophy department. Satterthwiate studied economics both as an undergraduate and a graduate student, and now teaches at a school of management. Their work has opened floodgates of investigations into the value and role of information in making decisions. Together with Arrow's Theorem, the Gibbard-Satterthwiate Theorem stands as a giant pillar guiding investigations into voting and collective decision making.
 (Photo of Allan Gibbard. Courtesy of Allan Gibbard and Molly Mahony)
 (Photo of Mark Satterthwaite. Courtesy of Mark Satterthwaite and Donald Saari)
Who studies fairness, voting and elections?
While it might seem that the natural people to be experts on voting and elections would be political scientists, this is only part of the picture, as we have seen . Starting with reformers in the 18th century, many individuals have thought about and made significant contributions to voting and elections. One sees the names of individuals from many countries, times, and backgrounds. Thus, Arrow, Borda, Michel Balinski, Condorcet, C. L. Dodgson (Lewis Carroll), Allan Gibbard, John Kemeny, Hervé Moulin, Donald Saari, Mark Satterthwaite and H. P. Young range over long periods of time, many professions and nationalities, but all sharing the common goal of using a mathematical lens to study fairness questions.
Until democratic societies find the best way to organize and run their elections, and mathematics is doing its part to try to find a way to accomplish this, one important thing you can do to support democracy is to VOTE!
References:
Amy, D., Real Choices/New Voices: The Case for Proportional Representation Elections in the United States, Columbia U. Press, New York, 1993.
Arrow, K., Social Choice and Individual Values, Wiley, New York, 1963.
Balinski, M, Le suffrage universal inachevé, Éditions Belin, Paris, 2004.
Balinski, M., What is just? Amer. Mathematical Monthly, 112 (2005) 502-511.
Balinski, M., Fair majority voting (or How to Eliminate Gerrymandering), Amer. Mathematical Monthly 115 (2008) 97-113.
Balinski, M. and H. Young, Fair Representation, 2nd. edition, Brookings Institution, Washington, 2001.
Black, D., Theory of Committees and Elections, Cambridge U. Press, Cambridge, 1958.
Blair, G. Cumulative voting: An effective electoral device for fair and minority representation, Annals of the New York Academy of Sciences, 219 (1973) 20-26.
Brams, S., Paradoxes in Politics, Free Press, New York, 1976.
Brams, S. Mathematics and Democracy: Designing Better Voting and Fair-Division Procedures, Princeton University Press, 2008
Brams, S., Voting Systems, in Handbook of Game Theory, Volume 2, ed. R. Aumann and S. Hart, Elsevier Science, New York, 1994.
Brams, S., and W. Lucas, P Straffin, (eds.), Political and Related Models, Springer-Verlag, New York, 1983.
Brams, S., and P. Fishburn, Approval Voting, American Political Science Review, 72 (1978) 831-47.
Brams, S., and P. Fishburn, Approval Voting, Birkhauser, Boston, 1983.
Brams, S., and J. Nagel, Approval voting in practice, Public Choice, 71 (1991) 1-17.
Cox, G., Making Votes Count: Strategic Coordination in the World’s Electoral Systems, Cambridge U. Press, New York, 1997.
Day, W. and F. McMorris, Axiomatic Consensus Theory in Group Choice and Biomathematics, SIAM, Philadelphia, 2003.
Dodgson, C., The Principles of Parliamentary Representation, Harrison and Sons, London, 1884, (Supplement, 1885; Postscript to the Supplement, 1885).
Doron, G., and R. Kronick, Single transferable vote: An example of a perverse social choice function, America J. of Political Science, 21 (1977) 303-311.
Dowding, K. and D. King, (eds.), Preferences, Institutions, and Rational Choice, Oxford U. Press, 1995.
Dummett, M., Voting Procedures, Clarendon Press, Oxford, 1984.
Elster, J. and A. Hyland, (eds.), Foundations of Social Choice Theory, Cambridge U. Press, Cambridge, 1986.
Enelow, J., and M. Hinich, The Spatial Theory of Voting: An Introduction, Cambridge U. Press, Cambridge, 1984.
Farquharson, R., Theory of Voting, Yale U. Press, New Haven, l969.
Fishburn, P., The Theory of Social Choice, Princeton U. Press, Princeton, 1973.
Fishburn, P., Monotonicity paradoxes in the theory of elections, Discrete Applied Math. 4 (1982) 119-134.
Fishburn, P., and S. Brams, Approval voting, Condorcet’s principle, and on-off elections, Public Choice, 36 (1981) 89-114.
Fishburn, P., and S. Brams, Paradoxes of preferential voting, Mathematics Magazine, 56 (1983) 207-214.
Fishburn, P., and W. Gehrlein, An analysis of simple two-stage voting systems, Behavioral Science, 21 (1976) 1-12.
Fishburn, P., and W. Gehrlein, An analysis of voting procedures with nonranked voting, Behavioral Science, 22 (1977) 178-85.
Friedman, J., (ed.), The Rational Choice Controversy, Yale U. Press, New Haven, 1996.
Gibbard, A., Manipulation of voting schemes: a general result, Econometrica, 41 (1987)587-602.
Green, D., and I. Shapiro, Pathologies of Rational Choice Theory: A Critique of Applications in Political Science, Yale U. Press, New Haven, 1994.
Hart, J., Proportional representation: Critics of the British electoral system 1820-1945, Oxford U. Press, Oxford, 1992.
Hoag, C. and G. Hallett, Proportional Representation, Macmillan, New York, 1926.
Luce, R. and H. Raiffa, Games and Decisions, Wiley, New York, 1957.
McLean, I., and A. Urken (eds.), Classics of Social Choice, U. Michigan Press, Ann Arbor, 1995.
Merrill, S., Making Multicandidate Elections More Democratic, Princeton U. Press, Princeton, 1988.
Merrill, S., Approval Voting: A “best buy” method for multicandidate elections?, Mathematics Magazine, 52 (1979) 98-102.
Moulin, H. Axioms of Cooperative Decision Making, Cambridge U. Press, New York, 1981.
Moulin, H. Social Choice, in Handbook of Game Theory, Volume 2, ed. R Aumann and S. Hart, Elsevier Science, New York, 1994.
Plott, C. and M. Levine, A model of agenda influence on committee decisions, Amer. Econ. Rev., 68 (1978) 146-160.
Poundstone, W., Gaming the Vote: Why Elections Aren't Fair and What We Can Do About It, Hill & Wong, 2008.
Quattrone, G. and A. Tversky, Contrasting rational and psychological analyses of political choice, American Political Science Review, 82 (1986) 719-36.
Rae, D., The Political Consequences of Electoral Law, revised edition, Yale University Press, New Haven, 1971.
Rae, D, Equalities, Harvard U. Press, Cambridge, 1981.
Riker, W., The Art of Political Manipulation, Yale U. Press, New Haven, 1986.
Saari, D., Geometry of Voting, Springer-Verlag, New York, 1994.
Saari, D., Basic Geometry of Voting, Springer-Verlag, New York, 1995.
Saari, D., Chaotic Elections!, American Mathematical Society, Providence, 2000.
Saari, D., Decisions and Elections, Cambridge U. Press, New York, 2001.
Satterthwaite, M., Strategy-proofness and Arrow’s conditions: existence and correspondence theorems for voting procedures and social welfare functions, J. of Economic Theory, 10 (1975) 187-217.
Sawyer, J. and D. MacRae, Game theory and cumulative voting in Illinois: 1902-1954, American Pol. Sci. Rev. 56 (1962) 936-946.
Straffin, P., Topics in the Theory of Voting, Birkhauser, Boston, 1980.
Taylor, A., Social Choice and the Mathematics of Manipulation, Cambridge U. Press, New York, 2005.
Tideman, N., Collective Decisions and Voting, Ashgate, Burlington, VT., 2006.
Young, H., An axiomatization of Borda’s rule, J. Econ. Theory, 9 (1974) 43-52.
Young, H., Social choice scoring functions, SIAM J. of Applied Mathematics, 28 (1975) 824-38.
Young, H., Condorcet’s theory of voting, America Political Science Review 82 (1988) 1231-44.
Young, H., Equity in Theory and Practice, Princeton U. Press, Princeton, 1994.
Joseph Malkevitch
York College (CUNY)
malkevitch at york.cuny.edu
Those who can access JSTOR can find some of the papers mentioned above there. For those with access, the American Mathematical Society's MathSciNet can be used to get additional bibliographic information and reviews of some these materials. Some of the items above can be accessed via the ACM Portal , which also provides bibliographic services.