No Static at All: Frequency modulation and music synthesis
Posted March 2009.
In this article, we'll consider how our ears are able to detect sound and how mathematics gives a powerful way to understand sound and then create and manipulate it....
David Austin
Grand Valley State University
david at merganser.math.gvsu.edu
Introduction
Music and mathematics are both deeply expressive languages whose mysteries are revealed through pattern and serendipity. The composer John Chowning, whose work is the focus of this article, says:
Music is a symbolic art. A painter gets the sensory feedback immediately, but musicians are used to writing things on paper and hearing them later. So they have to deal with symbols, things that are some distance away from where they are at the sensory level. It might be why music was the first of the arts to make so much artistic use of the computer.
There is more to the connection, however: The nature of sound and human hearing lend themselves to mathematical investigation. In this article, we'll consider how our ears are able to detect sound and how mathematics gives a powerful way to understand sound and then create and manipulate it. In particular, we'll look at Chowning's discovery of frequency modulation synthesis, an elegant technique for creating complex sounds that was used in the first commercially successful music synthesizers produced in the 1980s.
The perception of sound
Sound is caused by variations in air pressure and is perceived by the human ear's ability to detect those variations. This is a fairly complicated, but interesting, story worthy of greater study; however, we have other aims in this article and will content ourselves with the following relatively simplistic view.
Suppose that a tree falls in the forest. The resulting vibrations of earth and tree cause the pressure of the nearby air to vibrate as well. These vibrations in the air's pressure propagate through the air as a longitudinal wave moving at the speed of sound (roughly 768 miles per hour). Standing in one place, we may notice the air pressure changing periodically as shown below.

Of course, this is a particular type of vibration modelled by a sine function. As we'll see soon, this type of vibration is a building block for many kinds of sounds--namely, any periodic vibration can be expressed as an appropriate sum of sinusoidal vibrations--and we call it a pure tone. For now, let us note that there are two important features of the sinusoidal vibration: frequency and amplitude.

The length of time required for one cycle to move past is called the period T. The frequency f is simply the number of cycles that move past in a given amount of time. We therefore have the relationship f = 1/T.
We will measure frequencies in cycles per second, a unit often called Hertz and abbreviated Hz. Our brains interpret the frequency of a pure tone as the pitch of the tone. We are capable of hearing frequencies between roughly 20 Hz and 20,000 Hz.
The amplitude A is the height of the sinusoidal function and is detected by our ears as the volume of the tone.
The air pressure, as shown above, may be described as
A sin(2π ft + p)
where p is a constant known as a phase shift. In some sense, the phase shift is not really a property of the vibration but rather a quantity that reconciles our system of time-keeping--that is, what time we call t = 0--with the particular vibration we are studying. In a pure tone, such as the one above, our ears will therefore not detect the phase shift. Phase shifts become relevant when two or more pure tones are sounded together; we will not, however, concentrate on this here.
Here's how a sinusoidal wave sounds at 440 Hz. This is the A above middle C that the oboe uses to tune the orchestra. Sounds like this are used in hearing tests for reasons we will understand shortly.
When the air pressure's vibration reaches our ear, it is ultimately transmitted to the basilar membrane, a membrane within the cochlea that separates two fluid-filled tubes. The stiffness of the membrane varies along its length.
For our purposes, it is instructive to model each point of the basilar membrane as a damped harmonic oscillator. As the stiffness of the basilar membrance causes the amount of dampening to vary along the membrane's length, the resonant frequency of the oscillator at each point varies as well. Therefore, when a sinusoidal wave of a particular frequency is transmitted to the basilar membrane, it causes a particular point to vibrate in resonance with that frequency. The location of this point is sent to the brain, which interprets this information as the pitch of the vibration.
The important point for us is that the physiology of the humar ear naturally causes the ear to break sound into constituent sinusoidal vibrations, whose vibrations are localized on the basilar membrane. Remarkably, this physiological situation beautifully mirrors our mathematical theory of sound.
A quick tour of Fourier analysis
Since a sinusoidal wave triggers a response on a localized portion of the basilar membrane, how are we able to process more complicated sounds?
To answer this question, let's look at an example. Here is the sound created when the G string of a Collings OM-1 guitar was picked. A pure tone G corresponds to the frequency 392 Hz. Shown below is a portion of the waveform from that sound file taken about one second after the string was picked. This figure shows six cycles of a 392 Hz wave, or a time interval of 6/392 seconds.

Notice that the waveform appears periodic though it is not a pure tone. How do our ears make sense of this waveform?
The answer is given by the surprising theory of Fourier series, introduced by Joseph Fourier in the early nineteenth century. Simply said, any well-behaved peroidic function of frequency f can be realized as a sum, most likely infinite, of sines and cosines whose frequencies are multiples of f. That is, if g(t) is periodic with frequency f, then there are constants an and bn , indexed by n, such that

This is a remarkable expression. We know that the sine and cosine functions are periodic. Fourier's expression says that any periodic function may be written in terms of sine and cosine functions. In other words, any sound caused by a periodic vibration may be decomposed into pure tones.
Using the relationship,

we may write

This is particularly useful if we remember that our ears are configured to detect sinusoidal vibrations. If the wave g(t) reaches our ear, the locations on the basilar membrane corresponding to multiples of f detect the constants cn, the amplitude of the pure tone of frequency f, and send them to the brain, which reassembles the information so as to recognize, say, the G string of a Collings OM-1 guitar.
We should also note that the constants anand bn, known as Fourier coefficients, are computed by integrating over one period T = 1/f:

This explains why a0 is divided by 2 in the expression for g(t).
As we'll see, the terms for large values of n usually do not contribute too much to the infinite sum, and we will approximate the function g(t) by a finite number of terms. If we are looking at periodic waveforms coming from sound, it seems safe to do this since our ears will not detect the higher frequency components anyway. (To some, this may be a controversial statement. Some audiophiles claim that the higher frequency components of a sound still shape the sound even though they may not be directly detected by the basilar membrane. This is a rather common complaint about the reproduction of music from CDs, which filter out frequencies above 20,000 Hz, compared with, say, vinyl records, which don't.)
I computed the coefficients assuming a fundamental frequency of f = 196 = 392/2 and found the following expression to describe the waveform.

I found these coefficients using the expressions above by averaging the coefficients obtained over several cycles. Shown below is the original waveform in blue and the Fourier approximation, using the first 50 terms that correspond to frequencies in the audible range, in red.
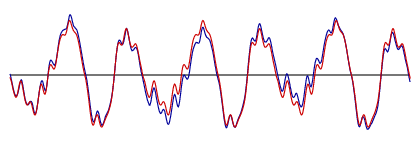
I then constructed a sound file using the Fourier series shown above. For the sake of comparison, here is a sound file taken from the original recording of the guitar, beginning at the time from where the Fourier coefficients are computed. This is an interesting comparison: The Fourier series does a fairly good job of capturing the tone of the instrument. However, the sound of the guitar string--more specifically, the loudness and the timbre--changes in time. If we want to recreate the sound of the string using a computer, we will somehow have to recreate the evolution of these features of the sound. But it seems that we have taken an important first step.
Since this technique is based on the addition of various waveforms, this form of music synthesis is called additive synthesis.
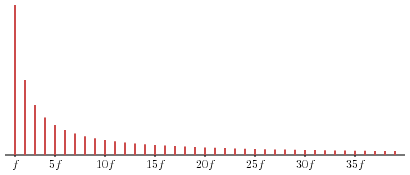
Shown below is a plot of the coefficients cn for each of the frequencies that contribute to the string's sound at the time I sampled it.

This plot displays the spectrum of the sound, the frequencies that are present and how much they contribute. A sound's spectrum influences our interpretation of it and enables us to distinguish between, say, different musical instruments. We perceive the spectrum as an instrument's timbre. In addition, we call this a harmonic spectrum since every frequency present is a multiple of one particular frequency, f = 196 Hz, in this case.
The sample above was taken about one second after the string was picked. I also sampled the sound about 3.5 seconds after the string was picked and found this:
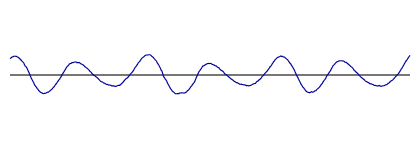
The wave seems to have smoothed out quite a bit, which we might imagine is caused by a diminishing contribution from higher frequencies. The spectrum, shown below, shows only a small contribution from higher frequencies as well as an overall decrease in the energy present.

Here is another waveform from a 0.02 second time interval of one channel from a live performance of the band Wilco performing "Muzzle of Bees." In this section of the song, there is an electric guitar, two acoustic guitars, an electric bass, keyboards, and drums.

Clearly, this is a more complicated waveform reflecting the fact that there are many more instruments playing. While there seem to be repeating features, the entire waveform does not appear to be periodic. In this case, the waveform is simply the sum of all the waveforms from the individual instruments. It is therefore enough to understand the individual instruments, perhaps like we've done above, and combine them using additive synthesis.
Here are two other periodic functions and their spectra:
Frequency Modulation
Our discussion above shows us that we could use a computer to create the sounds of various instruments, through additive synthesis, if we simply knew the Fourier coefficients for the instrument and how they evolve in time. However, additive synthesis is relatively inefficient. Adding together 50 terms in the Fourier series to create a two-second sound file, with the usual 44,100 samples per second, required my reasonably fast laptop to run for 13 seconds. I used a rather simplistic technique; there are faster ones available. The point, however, is that efficiency is an issue that needs consideration, especially if we want to make music in "real time."
We will now describe a technique, called Frequency Modulation (FM) synthesis, that allows us to more efficiently create sounds with complex spectra and to specify how those spectra evolve over time.
As a first experiment, let's take a pure tone of frequency fc and add vibrato. To do this, we will slowly vary the pitch, which is how we interpret the frequency of the pure tone. We begin with I sin(2π fmt), a wave of amplitude I and frequency fm, that modulates the pure tone by:

Shown below in blue is a frequency modulated wave with fc = 100 Hz modulated by a fm = 20 Hz wave, shown in gray, using an index of modulation I = 2.

Notice that the parameter I, which we call the index of modulation, allows us to control how much influence the modulating wave has. For instance, if I = 0, there is no modulation.
Here's the result of a 440 Hz pure tone modulated by a 5 Hz wave with index of modulation I = 2.
In what sense are we varying the frequency? Modulation varies the instantaneous frequency of the wave. For instance, if we write our wave as sin(2πφ(t)), we define the instantaneous frequency as the derivative dφ/dt. For a pure tone, we have φ(t) = ft so that the instantaneous frequency is f as we expect. In the case of a frequency modulated wave, we have

so that the instantaneous frequency is fc + Ifmcos(2π fmt). Notice that the instantaneous frequency varies between fc ± Ifm.
Frequency modulation is, of course, commonly used in radio transmissions, and for this reason the frequency fc is known as the carrier frequency, and fm is known as the modulating frequency. That FM synthesis is a useful technique for creating musically rich sounds was discovered by John Chowning in the early 1970s. Beginning with something like the vibrato we just created, he increased the modulating frequency into the audio range to create what he later called "extreme vibrato."
To hear this effect, listen to this sound file in which a 440 Hz carrier wave is modulated by a wave whose frequency increases from 20 Hz to 440. Notice how the sound is initially very similar to the vibrato we constructed earlier. It then becomes more complex in ways we will understand in a moment.
To hear the effect of varying the index of modulation I, here is a sound file in which a 440 Hz carrier wave is modulated by a wave of the same frequency while the index of modulation I increases from 0 to 5. Notice how the sound begins as a pure tone and becomes more complex.
A frequency modulated wave is relatively easy to generate compared to, say, adding together 50 terms of a Fourier series. FM synthesis therefore allows us to create complex spectra with relative ease.
The role of Bessel functions
The spectra of frequency modulated waves may be elegantly described using Bessel functions.
In our discussion of Fourier series, we began with a periodic function and wrote it as a linear combination of sine and cosine functions. For reasons we'll understand momentarily, we will consider the periodic function sin(z sin t) of period T = 2π and frequency f = 1/2π. The constant z is a parameter that will soon play the role of the index of modulation.
The Fourier series has the form:

Notice that our function is odd--sin(z sin(-t)) = sin(-z sin t) = -sin(z sin t)--which implies that

This function has another symmetry--sin(z sin(t+π)) = -sin(z sin t)--from which it follows that the coefficients b2n = 0. This leaves:

Since the Fourier coefficients depend on z, we will denote them as J2n+1(z) giving us

Similar reasoning leads to

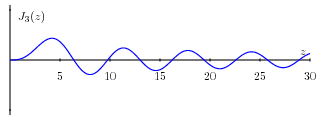
The coefficients Jn(z) turn out to be Bessel functions, functions that are well known to mathematicians. Bessel functions are ubiquitous as they arise, for example, when describing solutions to certain physically interesting partial differential equations. The vibrations of a round drum are described by Bessel functions.
Here are the graphs of the first six Bessel functions. Understanding the shape of these graphs will help explain some features we will encounter soon.
In what follows, it is convenient to define Bessel functions for negative indices using the relation J-n(z) = (-1)nJn(z). This enables us to write
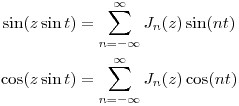
Let's go back to our expression for a frequency modulated wave and apply the angle addition relation:

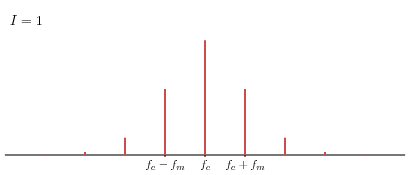
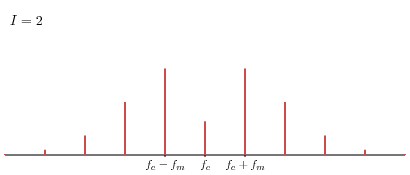
This is an important relation because it shows that the frequencies, sometimes called sidebands, fc + nfm form the spectrum of the frequency modulated wave. Moreover, the value of the Bessel functions Jn(I) determine how much the sideband fc + nfm contributes to the overall sound.
Notice that the spectrum will be harmonic precisely when the ratio fm/fc is rational since, in this case, the sidebands are all integer multiples of a common frequency.
Here are the spectra and corresponding sounds for various values of the index of modulation when fc = 440 Hz and fm = 88 Hz.
Crucial to Chowning's observation that FM synthesis was a useful technique for creating complex spectra is the contribution from sidebands fc + nfm that give negative frequencies. How can we interpret these frequencies? Since the sine function is odd, we may consider them as producing an inverted wave with positive frequency using:
Jn(I) sin(2π(fc + nfm)t) = -Jn(I) sin(2π|fc + nfm|t).
As Chowning writes in his original paper on FM synthesis:
The special richness of this FM technique lies in the fact that there are ratios of the carrier and modulating frequencies and values of the index [of modulation] which will produce sideband components that fall in the negative frequency domain of the spectrum. These negative components reflect around 0 Hz and "mix" with the components in the positive domain. The variety of frequency relations which result from this mix is vast and includes both harmonic and inharmonic spectra.
|
Chowning first considers the case when fc = fm. Here are the Fourier coefficients for all frequencies.
|
 |
|
Now let's reflect and invert the coefficients corresponding to negative frequencies so that two coefficients add for each frequency. The darker bars represent the Fourier coefficients from the positive frequency while the light bars represent the inverted contribution from negative frequencies.
|
 |
|
Finally, we show the absolute value of the total coefficients: This example illustrates Chowning's point: in this relatively simple way, we have produced an interesting and fairly complex spectrum.
|
 |
|
As we noted earlier, when the ratio of the modulating and carrier frequencies is rational, we will obtain a harmonic frequency. An inharmonic spectrum results when the ratio fm/fc is the square root of 2, which is the irrational number approximately equal to 1.414... Notice how the reflection of negative frequencies causes varying distances between the frequencies.
|
 |
Finally, let's consider a different modulating frequency now: fc = 220 Hz and fm = 440 Hz. The sidebands will all be odd multiples of 220 Hz.
The envelope, please
So far, we have seen how to make sounds with a particular pitch (frequency) and to create interesting timbres (spectra). When we studied the sound of the guitar string being picked earlier, however, we noticed two things. First, the timbre changed over time: the spectra started out relatively rich but eventually settled down to closer to a pure tone. Second, the volume of the sound changed as well. If we are using the frequency modulated wave,
Asin(2π fct + Isin(2π fmt)),
then the timbre will be controlled by I and the loudness by A. We make both of these time-dependent by assigning them an envelope, which specifies how they change in time.
A common model used is the ADSR envelope, which has four distinct phases: Attack, Decay, Sustain, and Release. A typical graph is shown below.
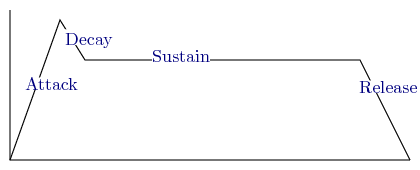
The sounds of many instruments follow this model. For instance, in a wind instrument, the sound is initiated as air begins to move through it. This is the attack phase. The wind eventually levels off during the sustain phase and dies off during the release. We may customize the sound by adjusting the transition points between intervals.
The exponential envelope is another commonly-used envelope as it provides a good model for the amplitude of a percussion instrument or a plucked string.

Some examples
In his original paper, Chowning showed how FM synthesis could be used to simulate some instruments.
Brass: We may mimic a brass instrument by choosing fm = fc and using the same ADSR envelope for the amplitude and index of modulation. (Earlier we saw the spectrum that results from choosing equal carrier and modulating frequencies.) Here is the sound file.
Bell: When a bell is struck, its spectrum is initially very rich. However, after some time, one frequency begins to dominate. For this reason, we will use an exponential envelope as the index of modulation I.
How should we choose the modulating frequency? Remember that we earlier saw that we obtain a harmonic spectrum--that is, all frequencies in the spectrum are multiples of a common frequency--when fm is a rational multiple of fc. A bell, however, has an inharmonic spectrum. For this reason, we will choose a ratio fm/fc that is not well approximated by a rational number. Namely, we will choose fm = φfc where φ is the golden ratio, approximately 1.618.... (An explanation of this choice is provided in an earlier Feature Column.)
Here is the result when fc = 440 Hz and an exponential envelope is used for the index of modulation. We initially hear many frequencies present but most of these die out, and we are left with a pure tone of 440 Hz.
Of course, the volume of a real bell decays in time as well so we will use an exponential envelope for the amplitude A.
Dave Benson suggests this demonstration in his book.
A wood drum: Chowning suggests that a wood drum can be made by using fm/fc = 1/φ and using these envelopes:
|
Amplitude
|
 |
|
Index of modulation
|
 |
Here is the sound file.
Guitar: I used FM synthesis to simulate the guitar's sound that we heard earlier. The spectrum that we saw looked like this:

I wanted to design a similar spectrum so I choose fc = 392 Hz, fm = 196 Hz = 392/2 Hz and I = 0.8. Using Bessel functions to predict the spectrum, we obtain this:

We also heard that the spectrum evolves over time to what sounds more like a pure tone. I therefore took an exponential envelope for the index of modulation beginning with I = 1 and decaying to I = 0.6 after five seconds.
Finally, I wanted to mimic the effect of striking a string with a pick and used this piecewise exponential function as the envelope for the amplitude, based mostly on educated guesses.
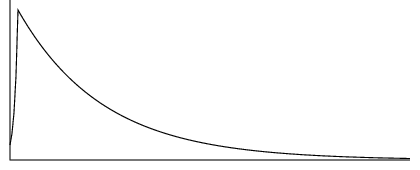
Here is the result.
Coda
In this article, we've only waded into the ocean of music synthesis. There are many other techniques for synthesis besides frequency modulation; I concentrated on FM synthesis here since it demonstrates, in a relatively simple way, how we can produce sounds by designing their spectra. Even if we restrict ourselves to additive and FM synthesis, these techniques may be strung together in countless ways to create novel sounds. Indeed, Chowning, working with Yamaha in the early 1980s, used these techniques to create the DX7, one of the first affordable and commercially successfully music synthesizers.
What is the current state of music synthesis? An interview with Chowning, published in Mix magazine in 2005 writes:
Chowning is very happy that the state of electronic music technology has reached the point that it has, just at the moment when he is able to retire from teaching and concentrate on composing. "The present is the dream for me," he says. "It's all software and real time and portable. I sit here with a laptop that has more power than I could ever use. .... Software synthesis is the take-off point for ultimate freedom."
Chowning says that a good synthesizer allows for a "high degree of expressive control....So it reveals virtuosity, or lack of it, and separates out the really good performers from others."
As a final note, it is interesting to consider how some music is recorded. Rather than recording a sound picked up by a microphone, a synthesizer's digital signal may be sent directly to the recording process. The first time that a "sound" is actually made is when a listener pushes the "Play" button. So who is making the music? For anyone who has experienced a concert where the performers and audience seem involved in a collaboration, the answer may not be so clear.
Liner notes
Technical Note: With the exception of the guitar recording, I created the sound files in this article using a Python program to write WAVE files. Interested readers are encouraged to try their own experiments. Csound is a free program that offers a huge range of possibilities (see the references). Dave Benson's book gives a very readable introduction to using Csound.
Dedication: This article is dedicated to my parents, who through Beethoven and Sinatra, gave their children a life-long love of music, and to my sister and brother, who have diligently tended that flame. Special thanks go to Richard Austin, who introduced the phrases "ring modulator" and "phase shifter" into my vocabulary before "Fourier series" made it there and who gave valuable assistance for this article by providing several guitar sound files.
References
- John Chowning, The Synthesis of Complex Audio Spectra by Means of Frequency Modulation, J. Audio Engineering Society, 21 (7), 1973. 526-534.
This is Chowning's original paper on FM synthesis and contains most of the ideas in this article.
- A talk with John Chowning, Part 1
A talk with John Chowning, Part 2
In this fascinating two-part interview, published in Mix magazine, Chowning discusses his discovery of FM synthesis as well as the future of electronic music.
- Wikipedia page on the Yamaha DX7
- Dave Benson, Music: A Mathematical Offering, Cambridge University Press, 2006.
Benson's book is freely available online. It is a delightful read and contains all kind of information that will be useful to anyone interested in mathematics and music. It is generally quite accessible.
- Csound: "Csound is a sound design, music synthesis, and signal processing system, providing facilities for composition and performance over a wide range of platforms."
Csound is a very powerful tool for experimenting with music synthesis. It is free and well documented. While I did not use Csound for producing the sound files in this article, learning to use it gave me greater insight into how the mathematical ideas in this article are used by professional musicians.
- Johannes Husinky, Comparison of the Frequency Spectra and the Frequency Decay of three different Electrical Guitars.
A study of the spectra, and their evolution, of a few different guitars.
- S. Marc Breedlove, Mark R. Rosenzweig, and Neil V. Watson, Biological Pyschology, Sinauer Associates. 2007. This book is accompanied by an online animation that explains how vibrations in the air are perceived by the ear and that illustrates the role of the basilar membrane.
- James Keener and James Sneyd, Mathematical Physiology, Springer, 2008.
The discussion of the human ear is in Chapter 20, Volume II of this two-volume set. The mathematical treatment here is rather advanced.
David Austin
Grand Valley State University
david at merganser.math.gvsu.edu
Those who can access JSTOR can find some of the papers mentioned above there. For those with access, the American Mathematical Society's MathSciNet can be used to get additional bibliographic information and reviews of some these materials. Some of the items above can be accessed via the ACM Portal , which also provides bibliographic services.


