Machine Scheduling Machine Scheduling
3. Paradoxical behavior
What is a paradox? A paradox is a situation where observations are not in accordance with experiences or expectations. Often paradoxes disappear when one gets a richer understanding of the "environment" in which the situation arises. If an additional lane is added to a highway because there are lots of delays on the road, and it turns out that the traffic problems get worse rather than better, this may seem like paradoxical behavior. However, a possible explanation is that when people hear about the added capacity of the road (the extra lane), they change their driving patterns to use that road whereas in the past they avoided it. So many new cars may be attracted to use the road with an extra new lane that more congestion results.
A variety of unexpected or "paradoxical" behaviors arise in bin packing and machine scheduling environments. For example, if we have a collection of weights to pack, we might guess that if a heuristic uses B bins to pack a certain list of weights, and one weight were deleted from the list, then the same heuristic would require B or fewer bins. Yet Ronald Graham was able to find an example with a capacity of 524 and 33 weights, in which 7 bins were filled using the First Fit Decreasing heuristic, while when one weight was omitted, 8 bins were required using the same heuristic!
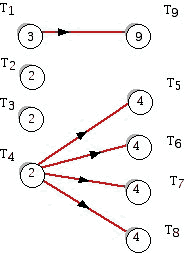
In the machine scheduling environment Graham also produced the following task analysis digraph. The nine tasks are labeled and the numbers inside the circles which represent the tasks are the times required to complete the tasks.

This example looks innocuous enough. First use the list processing algorithm to find the schedule on three machines that is generated using the task analysis digraph above and the list T1,...,T9. It turns out that the completion time for all of the tasks on three machines is 12. (The list produces a schedule whose only idle time is on the third machine from 2 to 4.) Note that the total time for all the tasks is 34 time units.
Now consider the following variants, where for each variant we choose the same list as above:
a. Reduce the time of each task by 1 (but schedule them on 3 machines)
b. Increase the number of machines to 4
c. Erase all the edges in the task analysis digraph so that the tasks are not constrained by precedences at all, and thus, are independent.
One might expect for each of these variant problems that the completion time would decrease, but this turns out not to be the case! The completion times for the cases (a) - (c) are, respectively, 13, 15, and 16. In each case, the result is a completion time which is longer than in the original problem description. Remember that in order to produce the schedule for (a), it is necessary to construct a new task analysis digraph with reduced task times.
In attempting to understand how this unintuitive behavior might arise, one must look back at the assumptions involved in the List Processing Algorithm. This algorithm assumes that no machine will remain voluntarily idle, nor can one interrupt a machine's work on a task once the machine begins (no preemption). Perhaps it is possible to avoid the seemingly unintuitive behavior demonstrated by the example above if we do not make these two assumptions. The difficulty is that these assumptions were made for a reason. They made it possible to formulate an algorithm which can solve quite large problems in a relatively short amount of time. One has to accept the tradeoff that although the algorithm does not always produce an optimal answer, and it can result in unexpected consequences, it still has a lot of appeal.
The moral here is that via dramatic examples, mathematics has the ability to show that one's intuitive expectations can not always be trusted!
- Introduction
- Modeling scheduling
- Paradoxical behavior
- Performance measures
- References


