Hurricane Sandy Meets Mathematics
A sensitivity to mathematics and its powerful analytical tools helps give insight into Sandy's devastation and how to minimize the consequences of future powerful storms...
 Joseph Malkevitch
York College (CUNY)
Email Joseph Malkevitch
Introduction
In late October 2012 a large storm, dubbed Hurricane Sandy, struck New Jersey and New York causing large areas of devastation in New Jersey, New York City, Long Island, and the counties north of New York City. What was remarkable about the storm was it resulted in a power black out for the southern part of Manhattan Island, an area that included Wall Street, even though there were some individual buildings that retained power. This area of NYC involves some of the most important businesses in America, including the New York Stock Exchange. One major hospital lost power, and neither of its two backup systems could be employed. Patients had to be evacuated. Several NYC tunnels that had never had water problems with prior storms were knocked out completely. Many of these difficulties occurred because of a surge of water in the NYC harbor area where the two rivers that bound Manhattan Island meet. This surge was unusually high due to a combination of the storm itself and the timing of high tides when the storm arrived. In some areas a second coastal storm dropped a heavy wet snow on trees already weakened by Hurricane Sandy, leading to additional power outages and tree damage.
American East Coast residents are familiar with seeing forecast images of hurricanes when they threaten land such as the one below, which shows the large size of Hurricane Sandy before it began to seriously affect the U.S. mainland.
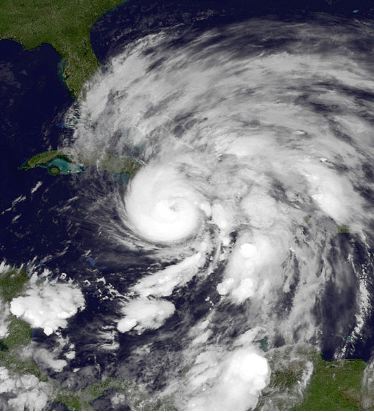
(Courtesy NOAA - National Oceanic and Atmospheric Administration)
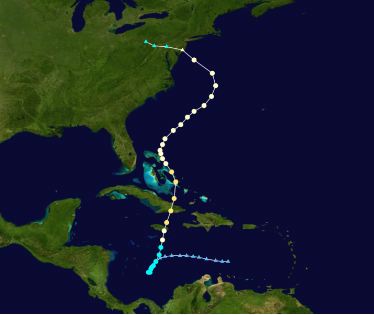
Like many hurricanes, Sandy affected not only the U.S. mainland but countries in the Caribbean. The track below shows the way hurricanes sometimes double back on their prior track (the track depends not only on the pattern of the Earth's rotation but more localized considerations such as land masses in its track and ocean temperatures). In Hurricane Sandy's case some human storm forecasters as well as computer models predicted that the storm would head out into the Atlantic instead of turning inland. One model commonly used in Europe predicted the course of Sandy very accurately though there is no guarantee it will do as well with the next hurricane.
(Courtesy of Wikipedia)
A sensitivity to mathematics and its powerful analytical tools helps give insight into Sandy's devastation and how to minimize the consequences of future powerful storms as well as ideas about how to optimize the speed of recovery after a large storm or other natural disaster.
What Sandy wrought
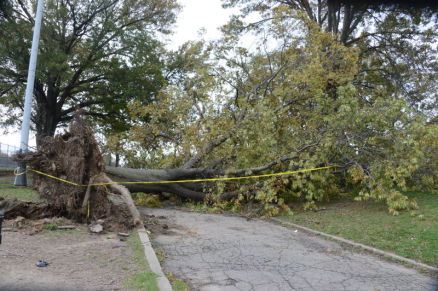
During and after Hurricane Sandy residents of the Metropolitan New York area (where I live) were flooded with images and information from many sources, including just taking a walk in one's neighborhood. Seeing large trees down, either blocking a street or severely damaging a home, was very common and gave one a sense of the tremendous power of the storm.
(NYC Parks Department: Crotona Park, Bronx, New York; Photo credit: Malcolm Pinckney)
There were also many images of whole neighborhoods without power (estimates for the NY area were that over 6 million people lost their power, many for a period of nearly two weeks), downed trees, houses swept off their foundations, and water in subway stations and basements of houses and buildings. The Hugh Carey Tunnel (also known as the Brooklyn Battery Tunnel- see below) was filled with water for the first time in its history. (Use of the tunnel was not returned to normal until over a month after the storm.) The storm caused many deaths and large amounts of human misery.
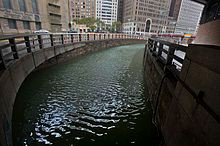
(Courtesy of Wikipedia, via the Metropolitan Transportation Authority of New York)
The severity of the storm's damage and the extended outage of power to a large part of Manhattan set off discussions about what seemed to some people to be an increase in the number of severe storms and their consequences for a world fast growing in population, especially in urban areas. Hurricane Sandy occurred at a time when many countries are having to come to grips with the consequences of the Earth's sky-rocketing population. This growing human presence has led to lengthy discussions about what effect mankind is having on the future of the planet and on mankind itself. Has the current population of the Earth affected the world's climate? If so, what does this mean for the future?
The current population of the Earth is estimated at over 7 billion people, though various sources differ as to when this milestone was reached. Mathematics suggests how hard it is to count such a large population accurately in the first place. Similarly, it is not so easy to find out how many trees Hurricane Sandy knocked down, how many people lost power, and how many people had flooded basements. If someone asked 100 people to count the number of jelly beans in a very large bag (perhaps 5000 items), would all the people get the same answer? How does our experience with situations such as this scale up for counting 7 billion people, many of them living in countries without governments that reach into local areas with regularity? Not only is it a challenge to count rural people, but counting people in large cities has its own challenges. Natural disasters and the consequences of climate change are tied to population in an indirect manner. If sea levels go up due to climate change, and there are more and more people living in large cities, many of which are located on coasts, then there will be increased consequences for a growing number of people. Population growth is both a local and global phenomenon.
Mathematics has a lot to say about the difference between local and global phenomena. A function may have many "local" maxima and minima which may or may not be global maxima and minima.
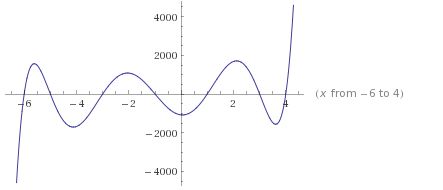
(Graph generated with Wolfram Alpha)
There are three local maxima and three local minima in the picture above as well as the global maximum on the right (a little to the right of x = 4), and a global minimum on the left (a little to the left of x = -6). One can easily design examples of polynomials (the example above was generated using a polynomial) which are defined on an interval which includes its end points. where the largest value on the interval occurs at a value which is also a relative maximum.
We all the know that the weather changes from day to day. Some days are nice, some days cool and some hot. One can have a hot spell or a dry spell. However, looked at this way, weather is a "local" matter - what is going on where I am in time, or very recently, or shortly into the future. However, trying to put storms like Hurricane Sandy in perspective requires both a local and a global perspective. I care how much damage my local neighborhood will sustain from a storm, but how often I can expect storms to affect my local neighborhood requires a more global perspective.
Comments?
Hurricanes?
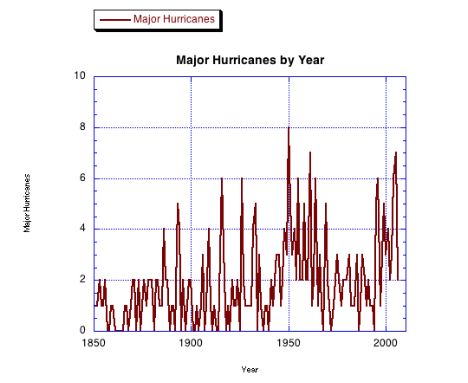
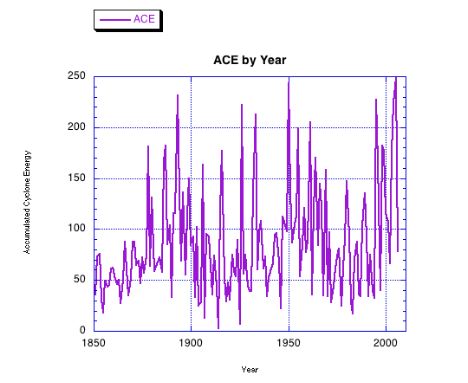
It is instructive to look at the data below - time series diagrams of the number of hurricanes, major hurricanes, and accumulated cyclone energy prepared by the National Oceanic and Atmospheric Administration (NOAA), of which the National Hurricane Center (NHC) is a part. The data below runs from 1851 to the present and represents only information about storms in the "Atlantic Basin." In addition to the diagrams the National Hurricane Center has tables with this and related data. As you look at the data, do you see what you think are short term trends, long term trends, cyclic behavior, etc.?
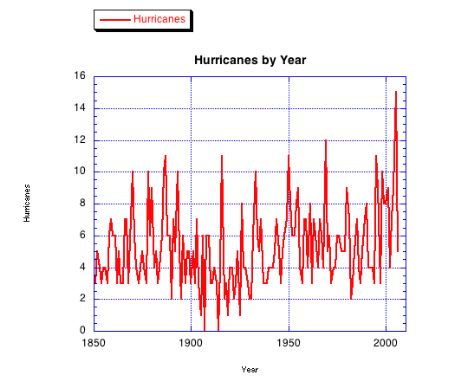
To construct such diagrams one has to give a definition of "hurricane" and stick to it. Are hurricanes the same or different from cyclones and typhoons? Here are the definitions (in red text) used by the National Hurricane Center, where kt refers to knots:
Hurricane / Typhoon:
A tropical cyclone in which the maximum sustained surface wind (using the U.S. 1-minute average) is 64 kt (74 mph or 119 km/hr) or more. The term hurricane is used for Northern Hemisphere tropical cyclones east of the International Dateline to the Greenwich Meridian. The term typhoon is used for Pacific tropical cyclones north of the Equator west of the International Dateline.
So, what is a cyclone? Here again from the National Hurricane Center:
Cyclone:
An atmospheric closed circulation rotating counter-clockwise in the Northern Hemisphere and clockwise in the Southern Hemisphere.
And what about a major hurricane?
Major Hurricanes = Saffir-Simpson Hurricane Scale 3, 4, or 5
The Saffir-Simpson Hurricane Scale is a "descriptive" system which tries to classify hurricanes in terms of their "destructiveness" by tying damage the storm does to the strength of its "sustained wind speeds."
And the meaning of ACE:
"ACE" = Accumulated Cyclone Energy - An index that combines the numbers of systems, how long they existed and how intense they became. It is calculated by squaring the maximum sustained surface wind in the system every six hours and summing it up for the season. It is expressed in 104 kt2.
So you can see meteorology, like mathematics, has its challenges with creating definitions that are clear and well-defined. The Saffir-Simpson Scale is a nominal scale where the higher numbers indicate higher wind speeds; thus it qualifies as an ordinal scale. You may recall that mathematicians work with other scientists to develop scales with characteristics fitting what is being measured. To do statistics with numbers requires that the measurements have properties that are consistent with the kind of statistical calculations that are being done. Thus, we have nominal scales, ordinal scales, interval scales, and ratio scales. For an ordinal scale the differences in the numbers that scale assigns are not fully meaningful. Euclidean distances are measured on a scale where the numbers can be subtracted or divided. Scales and measurement are fascinating topics on their own.
Mathematics brings to the study of any subject an interest in classification and making distinctions between similar but different things. While each hurricane is distinct from every other hurricane, hurricanes have many ways in which they are similar to each other. Exploiting insights into the differences and similarities of storms, while of interest for its own sake, is also of interest for policy decisions. These include questions about tying the pattern of recent storms to the need or wisdom for building new homes on the coast to standards which can resist higher levels of flooding than was necessary in the past, etc.
Hurricane Sandy has spurred the asking of new questions, some of them mathematical in nature. For example, one might try to construct a mathematical model for how small trees versus large trees behave in winds that come consistently from one direction or are coming from rapidly changing directions. What effects would pruning the crowns of large mature trees have on preventing them from uprooting during a hurricane? What happens when tree roots and/or leaves are water soaked? While some of these questions have received attention in the past, perhaps there is new motivation and/or data for helping get answers to these types of questions.
Studying data is always fascinating. However, for complex situations where information has changed accuracy with time, it is hard to tell if one should give the same weight to data from, say, 1900 - 1940 and 1970-2010 though each is a 40-year period of time. The tools we have for collecting and analyzing data about hurricanes have changed dramatically over the long period data has been collected. We now have automated temperature, wind, and barometric pressure sensors at many locations on land and at sea. We have satellites which monitor the size and intensity of storms and provide us with images that can be taken at regular intervals. Hopefully these images can help chart the path future hurricanes will take more accurately because this information is of vital assistance in avoiding loss of life and minimizing property damage.
Even if it is true that there are more storms now than in the past and/or that the intensity of storms has increased, the variability of where these storms hit and the tracks that they take is very "noisy" and hard to predict. Many people have had to rethink their lives in light of what happened due to Hurricane Sandy (and the other recent East Coast hurricane, Hurricane Irene - 2011) because their houses flooded or were damaged by trees that fell on their property, etc. The actions one might want to take have to be filtered with the information about the frequency of these storms and what paths future storms might take. Of course, Sandy was one of but many hurricanes which have caused loss of life and property damage. Many of the negative effects of hurricanes in terms of loss of life and property in a certain sense also stem from "human error" because preparation for recurrent storms has not been given adequate attention or people don't respond to the warnings given to them about the consequences of severe weather. If people are going to continue to build new homes in flood-prone areas (whether it be river flooding or flooding due to hurricanes), should such people be required to carry insurance or should society prohibit such practices outright? There is a trade-off to society for the economic value of constructing new homes and for costs when such homes become damaged by floods and storms. If compassion requires helping people whose homes have been destroyed by flood or storms, what share of the responsibility should others have to bear?
Comments?
Planning for storms before they occur
A well-known adage is that an ounce of prevention is worth a pound of cure. This thought applies to preparation for major storms as it does more generally. If one knows with high probability there will be major flooding in a certain area, then area residents might be required to leave their homes. This is a lot better plan than trying to rescue them at the 11th hour with helicopters or rescue teams in boats, when the people are on their roof tops with their cars floating away. If long-range forecasts for severe storms such as Sandy are available, then people in the path of the storm can be given reliable advice about how to protect themselves. Such actions range from boarding up windows and securing objects which might move in severe winds, to having adequate flashlights and batteries for the possibility of the loss of power, to evacuation. For some sizable communities evacuation is not a matter to be treated lightly because area roads may become strained by an evacuation order as well as there being issues of economic losses that occur when such action is taken. Tradeoffs between potential loss of life and economic losses put tremendous pressure on officials making decisions of this kind. In Italy recently seismologists were imprisoned after having been convicted for their role in what information was given to the public concerning the possibility of an earthquake, which, when it occurred, resulted in loss of property and life. To avoid this kind of thing from happening in the future, what should seismologists and meteorologists do when advising government officials about impending earthquakes, volcanic eruptions, or severe storms? Perhaps in part because of issues of this kind, the NYC subway and commuter rail systems were shut down quite a bit prior to the arrival of Hurricane Sandy. Although this inconvenienced a lot of people and "stranded" some who were unable to use public transportation to get where they needed to, it prevented the possibility of danger and/or loss of life to people who might have been trapped in a train within a tunnel when the tunnel was flooded. Assessing tradeoffs in risk and costs requires the building of complex models to determine what policies are the wisest.
Having lived through quite a few previous hurricanes on Long Island, I have observed one noticeable difference between this storm and prior ones: The extent of power outages. Nearly all of the homes in the village in which I live lost power at some point, and many homes for over a week. Two storm related realities, both not factors in previous storms I have lived through were:
* many traffic lights at intersections with heavy levels of traffic were not operating for as long as a week after the initial storm
* a "crisis" in obtaining gasoline occurred - partly because gas stations with power did not get deliveries of gasoline and partly because stations with gas did not have the power to pump gas!
LIPA, the Long Island Power Authority, which is in charge of providing power to the residents of Long Island, has taken a lot of "heat" for its performance in preparing for hurricanes in general and for the way that it responded to the challenge of having enormous numbers of customers on Long Island who did not have power. Long Island is also hampered by having many different levels of kinds of government. The part of Long Island outside of New York City consists of two counties, Nassau and Suffolk. The counties are subdivided into towns, cities and villages. Some services are provided by different governments. So when a tree falls down, it may be a tree from a private home that blocks a street which is maintained by the county while a different tree might block a village-maintained street. Then there is the issue of the power lines that might be knocked down by wind or by a falling tree. It would certainly appear as if more planning could have been done prior to the storm to make recovery quicker. At the very least it seems as if higher priority should be given in the plans LIPA makes for restoring electric service to working with local communities to make sure traffic signals are working again quickly, and some plan which would have avoided an extensive period of having gasoline stations without power. Certainly hospitals and commuter railroads must have priority but I have seen no publicly announced system of priorities for getting power restored.
Some areas of Long Island have many trees while others have almost no trees. One of the reasons that it took so long to restore power in some areas where there are lots of trees was limited information sharing about the complicated mosaic of the way power could be restored. Some of the restoration work was being done by crews which came to Long Island from far away places that had no power problem issues. However, it appeared that in some cases these crews could not be optimally employed because they did not know the "sequence" of what had to be done to efficiently restore power. In some cases there may be a single repair that would enable many people without power to have it restored. In other cases several steps would have to be done before power could be restored to a neighborhood, and it appeared that this work was hampered by no advance plan about how to structure the restoration of power.
During a dangerous storm such as Hurricane Sandy one is reluctant to send people into harm's way but for the highest possible benefits. If a homeowner reports a loss of power one hour into the storm, it probably does not make any sense to dispatch a crew to restore that house's power. On the other hand, if a hospital with 2000 beds has lost power and it's known that the cause is treatable quickly, one might want to send a crew there, even if the hospital can work for some time on backup power. In the case of Hurricane Sandy, power restoration work involved coordination with people who were removing trees so that power lines could be put back in place. It would make little sense to make a power line repair but have a new problem arise because of the tree removal problem or vice versa. Sometimes tree removal precipitated power problems which had not existed prior to the tree removal, but often trees had to be removed, because they were leaning against houses or other trees, and thus, were dangerous.
New York City had a different set of problems to recover from due to Hurricane Sandy. The unexpectedly high surge of water caused by the storm flooded locations near the rivers that surround Manhattan Island causing flooding in buildings, automobile tunnels, the subway system, and commuter and intercity rail systems. However, general principles of operation research, the branch of mathematics concerned with helping individuals, businesses and governments do their work more efficiently, had been carried out over a period of time based to some extent on previous emergency situations. For a long time the NYC subway system's component lines were organized so that if a break occurred in the "middle" of the line the trains would have to shut down because there were no intermediate locations where they could be turned around. Over a period of time the system was altered to create many places where trains could be turned around if necessary. For example, during the period that power was not available in the southern end of Manhattan, trains on Manhattan's West Side ran from the northern part of the Manhattan to a place (42nd St.) where they were turned around for the trip back north. This flexibility of the system allowed partial subway service to be available quite soon after the storm was over. This planning avoided a secondary disruption that would have occurred had partial subway service not been restored as quickly as it was.
Another problem the Metropolitan Transit Authority had to face was that several train tunnels under the East River were damaged when water flowed into them. These tunnels are used by three separate transportation systems: New Jersey Transit (commuter railroad), Long Island Railroad (commuter railroad), and Amtrak (intercity service for the Northeast corridor from Washington to Boston). Because of the wide availability of internet access via both computers and cell phones, as well as radio and TV, the public could be informed of temporary changes in schedules speedily. Trains were quickly rescheduled so that even though at one point only one tunnel was available and later only two tunnels were available, the demands of the NYC commuter rush hour could be handled by canceling relatively few trains and changing routes for others. Though the trains were very crowded, people who needed to get to work could be accommodated.
Comments?
Trees and wind
For past snowstorms and hurricanes that hit Long Island, while there has often been lots of damage and many power outages have occurred, the number of separate locales that had to be checked before power could be restored was relatively small. What happened with Hurricane Sandy was that the number of downed trees that caused separate "traumas" to the electrical network was very high. In this environment one needs some priority plan adaptable enough to sequence how to get things restored to normal, especially when the number of workers to carry out the restoration may be limited initially but would grow as more crews from distant locales became available to assist with the restoration efforts.
While many people may be affected by an outage, the way that the outage occurs can dramatically affect the restoration of power. If a "substation" of an electrical network experiences a problem, that may result in 30,000 people losing power in geographical area X. The repair to the substation may be complex and/or require lots of workers, but when the substation is restored to working order all 30,000 people will have their power restored at once. However, if 700 trees fall down in geographical area X, the total number of people affected may only be 26,000 but the effort to restore power may be much more complicated. In planning for recovery from a storm that will have a lot of wind damage, some communities have more trees than others and information of this kind can be taken into account with regard to where it may be necessary to have lots of recovery crews available.
For those who explored around their neighborhoods during the days soon after the storm - at least it was light outside when one had no power - to assess the local damage due to the storm, it was natural to speculate what characteristics the downed trees have in common. Were downed trees mostly of one particular species, one particular size, one particular type of root structure, or one particular age? This amateur observer could not see any particular pattern of these features but what was striking was that often clusters of trees near each other were the ones that went down.
Where is the damage?
One of the reasons that recovery can be complex after a storm is that the power company may not even know the location of the causes of outages. For example, LIPA has a system where people can report power outages but the system does not collect much useful information. The company may not have an easy way to tell if the outage is at a single home or a block of homes. If a single home reports a power outage this does not mean that the whole block does not have an outage because other people may not be home when the outage occurs to report that they, too, do not have power. At night, if I lose power I can go outside and often tell whether other houses on my block have power or not, but during the day this is not always easy to ascertain. I have urged my neighbors to always report outages and not assume some other person will have done so but I am reasonably sure that not all people do this partly because they are not sure of the procedure and partly because it is a "nuisance." I am not even convinced, however, that the power company can put to use this extra information that there is a cluster of outages, though in an "ideal world" they should be able to use this information. In particular, they should also be able to use past information about outages. For example, my side of the block, for reasons I don't truly understand, loses power much more commonly than people across the street or on the next block.
One way to solve many of these issues would be for the power company to take advantage of the new sensor technology which I assume could be adapted to send an automatic signal when a power disruption occurred somewhere. Such information could help speed the systematic restoration of power after an emergency. Unfortunately, power companies may be more concerned with issues of "profit" than providing customers with efficient power restoration after major storms.
Comments?
Mathematics to the rescue?
Mathematics may seem a small part of what is involved in dealing with severe weather-induced events such as floods and hurricanes. This does not mean it might not be a good idea for mathematicians to look at ways they can improve the models that are used to predict hurricane formation and tracking as well as ideas for recovery after such events. The notion of informing the public that insight from mathematics might help is a good one. Furthermore power companies might want to look into better operations research methods for their disaster recovery plans.
What are some of the tools or ideas that might be of use?
Queues
Queuing models might be of use to help minimize such secondary problems as the emergence of long lines at gasoline stations due to problems with allocating fuel to stations and power issues at stations. People lined up at gas stations even without knowledge if the stations had gas or if they expected an imminent delivery. There were two types of customers: those wanting small amounts of gas for their home electric generators and/or to put into their car which had run out of fuel and people who wanted to top off their tanks, etc. Many people who did not need gas were nervous and were getting it anyway, preventing people who had low tanks from getting gas when stations ran out. Police, at great cost, were assigned to prevent flaring tempers at gasoline stations when they might have been better used elsewhere.
Vehicle routing
When planning for how a cluster of homes in an area could have power restored, it might be possible to improve the time and cost efficiency of restoring power to these customers by using ideas related to the traveling salesman problem and vehicle routing. The idea is that to provide service at a collection of locales starting and ending at a depot, one can find a route which minimizes the time of visiting the sites. Problems for power are more complex because one will probably need to have estimates for the time to be spent at each site which may be hard to predict. It might also help to have this model be dynamic so if some new nearby site becomes eligible for power (perhaps because it has been certified by an electrician that damage to basement electrical equipment due to flooding has been corrected), then one can schedule this additional service stop when there will be a truck nearby instead of putting the customer at the bottom of a queue.
Wind damage
None other than Leonardo da Vinci studied the "geometry of trees." He noticed that if one cuts a tree horizontally one typically gets a circle for the truck and a collection of circles for the places where the tree has started to branch. Da Vinci claimed that the sum of the diameters of the branches was equal to the sum of the diameters of the trunck. While, not surprisingly, this model represents a vast simplification of the complexities one sees in tree growth, recently attempts have been made to study the accuracy of what da Vinci claimed, as well as to make his claims more precise. Interest in this matter has to do with being able to choose trees for planting that minimize tree loss in areas subject to hurricanes. Other parts of mathematics might be of use to understand what happens to the roots of trees when they are in very wet soil caused by the extensive rains often associated with hurricanes. Mathematics might also have value in designing pruning strategies for areas with lots of trees which are hit often by hurricanes. Much work has been done in trying to understand the mechanics of tree motion in strong and/or variable wind environments.
Were one to list mathematical tools that might come into play for getting insight into hurricane formation or storm damage and recovery, one might see on the list:
-
Fluid dynamics (for better insight into storm formation and tracking),
-
Queuing theory (for how to process requests for power restoration),
-
Mathematical programming (for models to restore power after storms),
-
Statistics (for better insights about where repair crews might be required), and
-
Operations research (improved efficiency of crews being assigned and moving between restoration sites), etc.
Applied mathematicians are very clever in using existing tools to study wide ranges of problems. They may also be inspired to do new mathematics based on situations which arise from storms or floods.
Comments?
Learning from the past
Hurricanes are complex storms and to understand them from "first principles" requires basic research in meteorology with the mathematical support of such subjects as fluid dynamics and numerical methods. The mathematical equations which explain what goes on in the Earth's atmosphere and how storms are "born" of a combination of effects due to the Earth's rotation, the nature of the oceans and its currents, and motion of the air, strains both theory and computer power. However, there is also insight to be obtained from comparing what has happened with predictions. There is "data" which shows how some storms of the past have not behaved as predicted. This can lead to the changing of the model that made the prediction by using additional information obtained from experience, but data can also be used in conjunction with an existing model to get further insight.
We can also learn from experiences (such as the long delays in restoring power in the NY Metropolitan area after Hurricane Sandy) about ways that more preparation prior to storms might be of use. Examples include developing expertise about the nature of the power grid in areas prone to power losses which might be time/cost effective in helping restore power, having in place adaptive ways to queue/schedule power restoration tasks based on some reasonable priority system, and finding ways to require gasoline stations to have backup power generators in case they lose primary power. Having power companies conduct tree-trimming work in areas that are prone to power outages might also be worthwhile.
Hopefully, these experiences LIPA and other power companies and governmental agencies had with Hurrican Sandy will prompt them to use all the mathematical tools at their disposal to ameliorate the consequences of future severe weather events.
Comments?
References
Anthes, R. Tropical cyclones: their evolution, structure and effects. American Meteorological Society, 1982.
Barnes, J., Florida's hurricane history, University of North Carolina Press, 2007.
Brewer, R and P. Merritt, Wind throw and tree replacement in a climax beech-maple forest, Oikos (1978) 149-152.
Bush, David M., and Orrin H. Pilkey, Mitigation of hurricane property damage on barrier islands: a geological view, Journal of Coastal Research (1994) 311-326.
Charney, J. and A. Eliassen, A., On the growth of the hurricane depression. J. Atmos. Sei. 21 (1964) 68-75
Duryea, M. and G. Blakeslee, W. Hubbard, and R. Vasquez, Wind and trees: A survey of homeowners after Hurricane Andrew. J. Arboriculture, 22 (1996) 44-50.
Duryea, M., Wind and trees: surveys of tree damage in the Florida panhandle after hurricanes Erin and Opal, 2011.
Emanuel, K., An air-sea interaction theory for tropical cyclones. Part I: Steady-state maintenance, Journal of the Atmospheric Sciences 43.6 (1986): 585-605.
Emanuel, K., The maximum intensity of hurricanes. J. Atmos. Sci. 45 (1988) 1143- 55.
Foster, D., et al., Simulating a catastrophic hurricane, Forests in Time: The Environmental Consequences of 1,000 Years of Change in New England, 2006.
Holland, G., 1980: An analytic model of the wind and pressure profiles in hurricanes, Monrhly Weather Rev., 108, 1212-1218.
Iman, R. and M. Johnson,C. Watson, Jr., Sensitivity analysis for computer model projections of hurricane losses, Risk Analysis, 25 (2005) 1277-1297.
Iman, R. and M. Johnson and C. Watson, Jr., Uncertainty analysis for
computer model projections of hurricane losses, Risk Analysis, 25 (2005) 1299-1312.
Iman, R. and M. Johnson and C. Watson, Jr., Statistical aspects of forecasting and planning for hurricanes, The American Statistician, 60 (2006) 105-121.
Katz, Richard W. "Stochastic modeling of hurricane damage." Journal of Applied Meteorology 41.7 (2002): 754-762.
Kaplan, J. and M. DeMaria, A simple empirical model for predicting the decay of tropical cyclone winds after landfall. J. App. Meteor., 34 (1995) 2499-2512.
Kunretuher, H., Mitigating disaster losses through insurance, Journal of Risk and Uncertainty, 12 (1996) 171-187.
Liu, H. and R. Davidson, T. Apanasovich, Statistical forecasting of electric power restoration times in hurricanes and ice storms, Power Systems, IEEE Transactions on Power Systems, 22 (2007): 2270-2279.
Merrill, R., A comparison of large and small tropical cyclones, Monthly Weather Review 112 (1984) 1408.
Miller, B., 1962: Characteristics of hurricanes, Science, 157, 1389-1399.
Ooyama, K., Numerical simulation of the life cycle of tropical cyclones, Journal of the Atmospheric Sciences 26 (1969): 3-40.
Riehl, H., Tropical Meteorology. McGraw-Hill, New York, 1954.
Rotunno, R and K. Emanuel, An air–sea interaction theory for tropical cyclones. Part II: Evolutionary study using a nonhydrostatic axisymmetric numerical model, J. Atmos. Sci 44 (1987): 542-561.
Sadowski, N., and D. Sutter, Hurricane fatalities and hurricane damages: are safer hurricanes more damaging?, Southern Economic Journal (2005): 422-432.
Swain, K.M. 1979. Minimizing timber damage from hurricanes. S. Lumberman 239:107-109.
Wakimoto, R. and P. Black, Damage survey of Hurricane Andrew and its relationship to the eyewall, Bulletin of the American Meteorological Society 75 (1994):189-202.
Wang, S., et al., Resource planning and a depot location model for electric power restoration, European Journal of Operational Research 155 (2004) 22-43.
Watson, C. Jr, and M. Johnson, Hurricane loss estimation models, opportunities for improving the state of the art, Bulletin of the American Meteorological Society, 85 (2004) 1713-1726.
Watson, C. Jr, and M. Johnson, M. Simons, Insurance rate filings and hurricane loss estimation models, J. Insurance Research, 22 (2004) 39-64.
Willoughby, H. and J. Clos, M. Shoreibah, Concentric eye walls, secondary wind maxima, and the evolution of the hurricane vortex, J. Atmos. Sci 39 (1982) 395-411.
Xu, K-M and K.. Emanuel, Is the tropical atmosphere conditionally unstable?, Monthly Weather Review 117 (1989) 1471-1479.
Yamasaki, M.. A preliminary experiment of the tropical cyclone without pa-
rameterizing the effects of cumulus convection. J. Meteorol. Soc. Japon. 55 (1977) 11-31
Yanai, M.. Formation of tropical cyclones. Rev. Geophys., 2 (1964) 367-414.
Note: Many New York area newspapers had stories about Hurricane Sandy, not only as the storm developed but also during the period after the storm hit. I found the articles in Newsday, a daily newspaper that centers around Long Island news, especially interesting.
A question about modeling hurricane evacuation routes was treated in one of COMAP's mathematical modeling competitions. The "outstanding papers" appeared in the UMAP Journal: 22.3, Fal 2001.
Those who can access JSTOR can find some of the materials mentioned above there. For those with access, the American Mathematical Society's MathSciNet can be used to get additional bibliographic information and reviews of some of these materials.
Joseph Malkevitch
York College (CUNY)
Email Joseph Malkevitch