PDFLINK |
Exploring Mathematical Scholarship through the Mathematics Collaboration Graph
Foreword
The AMS, through Mathematical Reviews, is an affiliate of MIDAS, the Michigan Institute for Data Science at the University of Michigan, Ann Arbor. As part of that affiliation, we have sponsored some research projects related to the work we do at Mathematical Reviews. The column below is written by Jonathan Gryak, a research scientist at the University of Michigan and MIDAS, and describes the results from a project he did on the collaboration graph inherent in our database of authors. His work updates and expands upon the work of others, as mentioned in his column. I find it fascinating, both as an interesting application of graph theory and for what the results say about mathematics as a collaborative profession. I am grateful to Jonathan for the research he has done and for his willingness to share it in this venue.
—Edward Dunne
Introduction
Social network analysis has a long history within the social sciences and bibliometric/scientometric communities, and has gained greater importance through the rise of Facebook, Twitter, and other online social networks. The social networks formed by research collaborations have often been studied through the creation of collaboration graphs, wherein authors are represented by nodes in the network and edges correspond to a co-authorship relationship.
It should come as no surprise that in mathematics there has been a long history of exploring the structure of the mathematical collaboration graph through graph-theoretic means. An author’s Erdős number, i.e., their degree of separation from the famously collaborative mathematician Paul Erdős, has been around for at least fifty years 7, with further investigations of the collaboration network of Erdős being performed by Grossman and others 589. Additionally, the work of Barabási et al. 1 analyzed the overall structure of the collaboration graph for mathematics and other disciplines over time, investigating structural properties including degree distribution, diameter, and clustering coefficients.
Inspired by these prior works, in this manuscript we provide results on the current state of mathematical collaboration using the Mathematical Reviews database maintained by the American Mathematical Society (AMS). Beyond Erdős we identify nine other “super-collaborators” using graph-theoretic methods and investigate their importance with respect to both graph-theoretic and author-level metrics. We also investigate various measures of importance that have become popular in the analysis of social networks in general.
Data
Using publication data extracted in February 2021 from the AMS Mathematical Reviews Database (MRDB), the collaboration graph was realized as a simple, undirected graph, with vertex set corresponding to individual authors and edge set where if authors and have at least one publication together, with each edge weighted by the total number of joint publications. At the time of data extraction, the MRDB had indexed 3,729,493 publications from 1,030,091 authors, yielding the collaboration graph with and .
The Collaboration Graph
We can learn a great deal about the community of mathematicians from examining the collaboration graph as a whole. We begin by examining the vertex degree , which corresponds to the number of collaborators a given mathematician has. Table 1 presents summary statistics for the distribution of vertex degrees. Scientific collaboration networks tend to have degree distributions with “fat tails,” i.e., ones that are well-approximated by a power-law, either in the number of papers published by an individual (1) or in the number of their collaborators 11. This is indeed the case for the collaboration graph and can be readily observed by viewing the complementary cumulative distribution function (CCDF) of the degree distribution, depicted in Figure 1, along with fitted power-law and log-normal distributions. From Figure 1A we can observe that the overall distribution of collaborators is well-approximated by a log-normal distribution, while Figure 1B shows the tail of the distribution for , which is fit equally well by both distributions.
The complementary CDF (CCDF) of the degree distribution along with fitted log-normal and power-law distributions.
All non-isolated vertices.
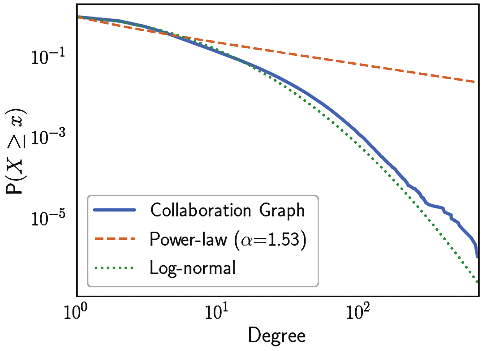
Tail only (degree ).

Nearly 11% (114,261) of authors represented in the Mathematical Reviews database have no recorded co-authors, these correspond to the isolated vertices of . Table 1 depicts summary statistics of the major subgraphs of .
Degree statistics for the major subgraphs of : - the union of all connected components of excluding singletons (isolated vertices); - the largest connected component; and - the second-largest connected component.
| Statistics | |||
| 915,830 | 812,400 | 41 | |
| Min | 1 | 1 | 1 |
| Max | 688 | 688 | 38 |
| Mean | 5.699654 | 6.140741 | 4.536585 |
| Stddev | 9.693462 | 10.1919 | 5.47766 |
Beyond degree, there are two other “d” properties that can illuminate the structure of the collaboration graph - density and distance. We will discuss density now and return to distance in the next section. The density of a graph is defined as the ratio of the edges in the graph to all possible edges. Graphs of low density - e.g., - are considered sparse, while those of high density - e.g., - are considered dense. Graph density impacts the data structures used to efficiently store a graph representation in memory, e.g., adjacency lists, and the computational costs associated with various graph algorithms. The density of is , indicating that despite the collaborative nature of mathematical research, is very sparse.
Author Relationships and Networks
Having examined the global properties and overall structure of the collaboration graph, we now turn to discovering distinct authorship (sub)networks and their attributes. There are numerous questions that we may ask about these relationships:
- •
How often do highly collaborative or independent authors tend to stay within their respective networks?
- •
Do co-authors tend to form working relationships independent of their mutual colleague?
- •
On average, how many co-authors separate any given pair?
- •
How important is any individual author to the collaboration network as a whole?
These and other questions are answered in the following subsections.
Assortativity
Assortativity is the tendency of vertices that are similar with respect to some measure to be connected. Degree assortativity, in which vertices of high or low degree tend to be connected to one another, is a general form of similarity that applies to all networks, though any categorical or numerical property assigned to each vertex can be used as an assortative measure. Following 12, assortativity, or assortative mixing, can be calculated for discrete properties of a vertex by defining the quantity : the fraction of edges within the graph whose ends are valued and . Assortativity is then calculated as the Pearson correlation coefficient
where and are respectively the fraction of edges that start or end with values and , with and their respective standard deviations. Assortativity ranges from -1 to 1, with -1 representing total disassortativity and 1 total assortativity. Graphs representing social networks, such as academic collaborations and personal connections, tend to be assortative, while natural networks, such as biological or ecological networks, tend to be disassortative 12. In 12, published in 2003, the degree assortativity of mathematical collaborations was . In , the degree assortativity is lower at , indicating that is not particularly assortative with respect to vertex degree. However, using an author’s total number of publications as the similarity measure, the respective assortativity rises to , indicating that mathematical authors who have a large number of publications tend to have published with each other more than authors who have a similar number of co-authors.
Cliques, clustering, and triads
Given a vertex with neighbors, the maximum number of edges is , and occurs precisely when and its neighbors form a clique. The local clustering coefficient for a vertex is the tendency of neighbors to form a clique, and is defined as the ratio of the number of edges between ’s neighbors and the maximum number of edges :
In the context of the Collaboration Graph, the value of the local clustering coefficient for a given author indicates how likely it is that ’s co-authors are co-authors independently of . The mean of the local clustering coefficient over the entire graph, , provides one measure of the global clustering coefficient, which for is 0.4696215 with standard deviation of 0.4388102. Excluding isolated vertices yields a higher (0.4308473). These are lower values than determined by Barabasi et al. 1, where , indicating a weakening of ties in co-authorship networks and continuing a downward trend identified in the same paper above.
A second measure of global clustering is transitivity, the tendency for two authors who share a common co-author (an open triad) to become co-authors themselves, forming a triangle, or closed triad. More explicitly, transitivity can be defined 13 as , that is, the ratio of closed triads to all triads, and ranges from 0 to 1. The transitivity of is 0.1340591 and remains constant when isolated vertices are excluded. This is much lower that transitivity values for other academic disciplines such astrophysics (0.414) 11 and statistics (0.320) 10, but higher than that in biomedical research (0.066) 11.
Authorship networks
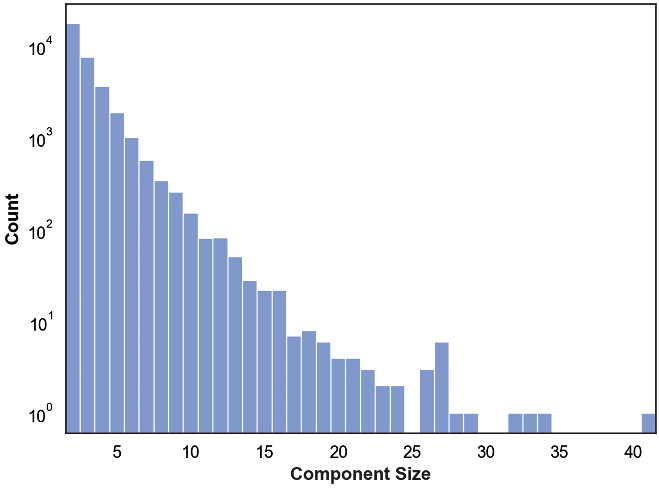
Authorship networks within the Collaboration Graph correspond to its connected components. There are 147,710 distinct connected components in , of which 114,261 are of size one, corresponding to the isolated vertices; removing these yields 33,449 connected components containing two or more vertices. The largest connected component contains 812,400 authors, roughly 79% of the entire graph, and captures 2,494,369 co-authorships. The existence of this large of a connected component is to be expected for real-world networks 13. Excluding these extrema, a histogram of the remaining connected component sizes is presented in Figure 2. As can be seen in the figure, the number of authorship networks of a given size decreases rapidly.
A histogram of connected component sizes when the smallest and largest components are excluded. Count is presented on the -axis in a logarithmic scale.
Eccentricity and seven degrees of separation
When considering distance between collaborators, there are potentially many paths, i.e., chains of co-authors, that might connect any given pair of authors. As such, we are interested in the geodesic distance, i.e., the length of the shortest path between vertices. For a given vertex , the eccentricity is the maximum length of all shortest paths between and . The maximum eccentricity of any vertex is called the diameter of the graph, while the minimum is called the radius. The diameter (longest chain of co-authors) of is 23, while the radius is 13. There are 10 peripheral vertices whose eccentricity is equal to the diameter, and 3,595 central vertices, whose eccentricity is equal to the radius.
Another distance measure of interest in social and other small-world networks 15 is the “degree of separation” between vertices. This notion can be quantified as the average shortest path length, calculated as
where is the geodesic distance between vertices and and . For , the average shortest path length is . Thus, on average mathematical co-authors have seven degrees of separation between them. This is slightly higher than the five to six degrees posited by Milgram 14 in his seminal work and popularized as “six degrees of separation.” However, this is concordant with the average path length and its trend over time as described in the 2002 work of Barabasi et al.1, in which the average shortest path for mathematical collaboration was estimated to be in 1991, which decreased to by 1998.
A comparison of structural properties of the collaboration graph and its various subgraphs, including the second largest component , is presented in Table 2. Among these subgraphs, is the only one that exhibits disassortativity.
Structural properties of the collaboration graph and various subgraphs: - the number of connected components; - assortativity; - average shortest path length; - the global clustering coefficient; - transitivity; and - diameter.
| Graph | ||||||||
| 1,030,091 | 2,609,957 | 147,710 | 0.08549151 | N/A | 0.4696215 | 0.1340591 | 23 | |
| 915,830 | 2,609,957 | 33,449 | 0.08549151 | N/A | 0.5282126 | 0.1340591 | 23 | |
| 812,400 | 2,494,369 | 1 | 0.07340353 | 6.923573 | 0.5312295 | 0.1306022 | 23 | |
| 41 | 93 | 1 | -0.2853268 | 1.970732 | 0.7888307 | 0.2701271 | 4 |
Articulation points
How important is any one author’s connections to the collaboration of mathematicians as a whole? The reliance of the collaboration graph or any other network’s connectivity on a single node can be made by identifying it as an articulation points or cut vertex: a vertex whose removal results in the disconnection of the network. The components resulting from the removal of an articulation point are called biconnected components (BICCs), while a graph containing no articulation points is said to be biconnected. The largest connected component is not biconnected as it contains 110,371 authors whose removal partitions the graph into two or more components.
The Super-Collaborators
Inspired by Grossman’s work 9 on that most peripatetic of mathematicians, we can analyze the mathematical collaboration graph to determine other super-collaborators like Paul Erdős. The top ten super-collaborators by number of co-authors (i.e., vertex degree) are listed in Table 3, along with author-level metrics obtained from Mathematical Reviews and Google Scholar where available.
Super-collaborators and their author-level metrics. The publications and reported citations are those indexed and tabulated within the Mathematical Reviews database (MRDB) as of February 2021. Citations (GS), -index, and -index were obtained from Google Scholar as of June 2021. The highest ranking by metric is bolded.
| Author | # Papers | Citations | Citations | -index | -index | |
| (MRDB) | (GS) | |||||
| Baleanu, Dumitru I. | 688 | 868 | 4,089 | 49,170 | 97 | 910 |
| Srivastava, Hari Mohan | 663 | 1,314 | 11,472 | 65,205 | 94 | 767 |
| Agarwal, Ravi P. | 618 | 1,645 | 16,265 | N/A | N/A | N/A |
| Chen, Guanrong | 569 | 720 | 3,720 | 109,004 | 155 | 986 |
| Cao, Jinde | 535 | 735 | 3,430 | 62,641 | 125 | 943 |
| Erdős, Paul | 510 | 1445 | 21,376 | 87,855 | 123 | 818 |
| Kurths, Jürgen | 502 | 318 | 1,453 | 89,341 | 128 | 885 |
| Alon, Noga | 473 | 624 | 12,164 | 51,988 | 107 | 499 |
| Pardalos, Panos M. | 448 | 510 | 2,779 | 57,110 | 104 | 715 |
| Balakrishnan, Narayanaswamy | 447 | 860 | 3,543 | 80,260 | 87 | 613 |
All super-collaborators are contained in , the largest connected component of . As described in the previous section, one measure of importance of a given author is the effect of connectivity when the author and their co-authorships are removed from the graph. Among the super-collaborators, Kurths is the only one who is not a cut vertex: his removal does not increase the number of connected components. For all other authors their removal results in one large connected component that is nearly (99.998% or greater) the size of , with the remaining biconnected components ranging in number from 3 to 13 and size from 1 to 11.
Centrality measures (who’s important?)
Biconnectivity is not the only way in which to measure the importance of a given member of a social network. Centrality is a measure of a node’s importance or potential influence in a network. There are several methods for calculating centrality that emphasize different aspects of the relationship of a node to its neighbors. Here we focus on four common centrality measures for undirected graphs - degree, closeness, betweenness, and eigenvector centrality. Degree centrality is simply the degree of vertex normalized by one less than the number of vertices in the graph:
Closeness centrality was introduced by Bavelas 23 and is calculated as
where is the geodesic distance between vertices and . As its name suggests, closeness centrality defines important nodes as being close to other nodes within the network. Betweenness centrality, on the other hand, defines important nodes as those who tend to connect other nodes in the network, i.e, they tend to be on the geodesic paths between other nodes. Betweenness was introduced by Freeman 6 and is defined as
where is the number of geodesics between vertices containing and is the total number of geodesics between vertices .
Finally, eigenvector centrality or eigencentrality, introduced by Bonacich 4, provides a measure of centrality in which more central nodes are those who are connected to other highly central nodes. Let be ordered as . Given the adjacency matrix of the graph, for the node corresponds to the th entry of the vector satisfying , i.e, an eigenvector of . An eigenvector corresponding to the largest eigenvalue is chosen so that all values are positive.
Spearman correlation of various centrality measures for authors in the largest connected component .

Super-collaborator rankings by centrality measure. The highest ranked author by each measure is bolded, while the next highest is italicized.
| Author | Mean w/o | Mean | ||||
| Baleanu, Dumitru I. | 1 | 12 | 7 | 19238 | 6.67 | 4814.5 |
| Srivastava, Hari Mohan | 2 | 4 | 2 | 12963 | 2.67 | 3242.75 |
| Agarwal, Ravi P. | 3 | 1 | 1 | 14658 | 1.67 | 3665.75 |
| Chen, Guanrong | 4 | 2 | 3 | 16036 | 3 | 4011.25 |
| Cao, Jinde | 5 | 9 | 9 | 21006 | 7.67 | 5257.25 |
| Erdős, Paul | 6 | 3 | 5 | 136 | 4.67 | 37.5 |
| Kurths, Jürgen | 7 | 11 | 6 | 22718 | 8 | 5685.5 |
| Alon, Noga | 8 | 8 | 13 | 22 | 9.67 | 12.75 |
| Pardalos, Panos M. | 9 | 6 | 4 | 2218 | 6.33 | 559.25 |
| Balakrishnan, Narayanaswamy | 10 | 126 | 11 | 23399 | 49 | 5886.5 |
Figure 3 depicts the Spearman (rank) correlation between all four centrality measures for One can observe that the rankings of authors by centrality measures are all positively correlated with each other, with closeness being on average the most correlated with other measures, followed by eigenvector centrality, while betweenness was the least correlated with other measures.
Table 4 contains the rankings of the super-collaborators by all four centrality measures, along with the mean ranking with and without including eigencentrality, which is the outlier among the rankings. From the table we can observe that Agarwal ranks the highest with respect to both closeness and betweenness and highest overall, while Srivastava is ranked second overall as well as in degree and betweenness centrality. Of the super-collaborators only Erdős and Alon have relatively high eigencentrality, indicating that they tend to be more connected to other highly eigencentric individuals.
Figure 4 depicts the Pearson correlation between the four centrality measures and their author-level metrics obtained from Google Scholar. In examining correlation between centrality measures and author-level metrics we find that closeness has the highest correlation with -index at 0.54, while betweenness has the highest correlation with both -index and citation count at 0.51 and 0.41 respectively. Eigencentrality is the negatively correlated with all author-level metrics, and strongly so for the -index with a correlation of . Within the author-level metrics themselves, -index is most correlated with citation count.
Pearson correlation between centrality measures and author-level metrics obtained from Google Scholar for all super-collaborators.

Future Directions
Additional realizations of the collaboration graph , such as the addition of edge weights corresponding to the number of joint publications between two authors, would allow for additional analyses that may yield further insight into mathematical collaboration. Moreover, the treatment of as a dynamic graph would enable us to understand trends in mathematical collaboration over time. Additional author data from the MRDB, including institution, country, and subject area encoded via Mathematics Subject Classification (MSC), could be used to assign multiple labels to each node and be used to illuminate additional collaborative relationships and community structures. The nine additional super-collaborators identified in this paper could have their relationships between other mathematicians and scholars explored as was done for Erdős in 5.
Conclusion
Inspired by prior works 1589, we have provided results on the current state of mathematical collaboration using the collaboration graph derived from information contained in the Mathematical Reviews database. Overall is a sparse graph whose vertex degree distribution is log-normal. The graph contains one large connected component containing nearly 79% of authors. Currently there are on average seven degrees of separation between mathematical collaborators, matching the decreasing trend over time as reported in 1. We identified ten “super-collaborators” using graph-theoretic methods, one of whom is Paul Erdős. For these “super-collaborators” we investigated their importance with respect to both centrality and author-level metrics, finding that closeness centrality is relatively highly correlated with -index. Future work can utilize additional author data from the MRDB, including institution, country, and subject area, to determine community structures and further explore the many ways in which mathematicians collaborate in pursuit of their common goal of advancing mathematical knowledge.
Acknowledgments
This work was funded in part by Mathematical Reviews, a division of the American Mathematical Society. Some analyses contained herein utilized computational resources and services provided by Advanced Research Computing at the University of Michigan, Ann Arbor.
References
- [1]
- A. L. Barabási, H. Jeong, Z. Néda, E. Ravasz, A. Schubert, and T. Vicsek, Evolution of the social network of scientific collaborations, Phys. A 311 (2002), no. 3-4, 590–614, DOI 10.1016/S0378-4371(02)00736-7. MR1943379Show rawAMSref
\bib{barabasi2002evolution}{article}{
  author={Barab\'{a}si, A. L.},
  author={Jeong, H.},
  author={N\'{e}da, Z.},
  author={Ravasz, E.},
  author={Schubert, A.},
  author={Vicsek, T.},
  title={Evolution of the social network of scientific collaborations},
  journal={Phys. A},
  volume={311},
  date={2002},
  number={3-4},
  pages={590--614},
  issn={0378-4371},
  review={\MR {1943379}},
  doi={10.1016/S0378-4371(02)00736-7},
}
Close amsref.✖ - [2]
- Alex Bavelas, A mathematical model for group structures, Human organization 7 (1948), no. 3, 16–30.Show rawAMSref
\bib{bavelas1948mathematical}{article}{
  author={Bavelas, Alex},
  title={A mathematical model for group structures},
  date={1948},
  journal={Human organization},
  volume={7},
  number={3},
  pages={16\ndash 30},
}
Close amsref.✖ - [3]
- Alex Bavelas, Communication patterns in task-oriented groups, The journal of the acoustical society of America 22 (1950), no. 6, 725–730.Show rawAMSref
\bib{bavelas1950communication}{article}{
  author={Bavelas, Alex},
  title={Communication patterns in task-oriented groups},
  date={1950},
  journal={The journal of the acoustical society of America},
  volume={22},
  number={6},
  pages={725\ndash 730},
}
Close amsref.✖ - [4]
- Phillip Bonacich, Technique for analyzing overlapping memberships, Sociological methodology 4 (1972), 176–185.Show rawAMSref
\bib{bonacich1972technique}{article}{
  author={Bonacich, Phillip},
  title={Technique for analyzing overlapping memberships},
  date={1972},
  journal={Sociological methodology},
  volume={4},
  pages={176\ndash 185},
}
Close amsref.✖ - [5]
- Rodrigo De Castro and Jerrold W. Grossman, Famous trails to Paul Erdős (Spanish, with English and Spanish summaries), Rev. Acad. Colombiana Cienc. Exact. Fís. Natur. 23 (1999), no. 89, 563–582. Translated and revised from the English. MR1744115Show rawAMSref
\bib{de2011famous}{article}{
  author={De Castro, Rodrigo},
  author={Grossman, Jerrold W.},
  title={Famous trails to Paul Erd\H {o}s},
  language={Spanish, with English and Spanish summaries},
  note={Translated and revised from the English},
  journal={Rev. Acad. Colombiana Cienc. Exact. F\'{\i }s. Natur.},
  volume={23},
  date={1999},
  number={89},
  pages={563--582},
  issn={0370-3908},
  review={\MR {1744115}},
}
Close amsref.✖ - [6]
- Linton C. Freeman, Centrality in social networks conceptual clarification, Social networks 1 (1978), no. 3, 215–239.Show rawAMSref
\bib{freeman1978centrality}{article}{
  author={Freeman, Linton~C.},
  title={Centrality in social networks conceptual clarification},
  date={1978},
  journal={Social networks},
  volume={1},
  number={3},
  pages={215\ndash 239},
}
Close amsref.✖ - [7]
- Casper Goffman, Mathematical Notes: And What Is Your Erdos Number?, Amer. Math. Monthly 76 (1969), no. 7, 791, DOI 10.2307/2317868. MR1535523Show rawAMSref
\bib{goffman1969and}{article}{
  author={Goffman, Casper},
  title={Mathematical Notes: And What Is Your Erdos Number?},
  journal={Amer. Math. Monthly},
  volume={76},
  date={1969},
  number={7},
  pages={791},
  issn={0002-9890},
  review={\MR {1535523}},
  doi={10.2307/2317868},
}
Close amsref.✖ - [8]
- Jerrold W. Grossman, The evolution of the mathematical research collaboration graph, Proceedings of the Thirty-third Southeastern International Conference on Combinatorics, Graph Theory and Computing (Boca Raton, FL, 2002), Congr. Numer. 158 (2002), 201–212. MR1985159Show rawAMSref
\bib{grossman2002evolution}{article}{
  author={Grossman, Jerrold W.},
  title={The evolution of the mathematical research collaboration graph},
  booktitle={Proceedings of the Thirty-third Southeastern International Conference on Combinatorics, Graph Theory and Computing (Boca Raton, FL, 2002)},
  journal={Congr. Numer.},
  volume={158},
  date={2002},
  pages={201--212},
  issn={0384-9864},
  review={\MR {1985159}},
}
Close amsref.✖ - [9]
- Jerrold W. Grossman and Patrick D. F. Ion, On a portion of the well-known collaboration graph, Proceedings of the Twenty-sixth Southeastern International Conference on Combinatorics, Graph Theory and Computing (Boca Raton, FL, 1995), Congr. Numer. 108 (1995), 129–131. MR1369281Show rawAMSref
\bib{grossman1995portion}{article}{
  author={Grossman, Jerrold W.},
  author={Ion, Patrick D. F.},
  title={On a portion of the well-known collaboration graph},
  booktitle={Proceedings of the Twenty-sixth Southeastern International Conference on Combinatorics, Graph Theory and Computing (Boca Raton, FL, 1995)},
  journal={Congr. Numer.},
  volume={108},
  date={1995},
  pages={129--131},
  issn={0384-9864},
  review={\MR {1369281}},
}
Close amsref.✖ - [10]
- Masaaki Inoue, Thong Pham, and Hidetoshi Shimodaira, Joint estimation of non-parametric transitivity and preferential attachment functions in scientific co-authorship networks, Journal of Informetrics 14 (2020), no. 3, 101042.Show rawAMSref
\bib{inoue2020joint}{article}{
  author={Inoue, Masaaki},
  author={Pham, Thong},
  author={Shimodaira, Hidetoshi},
  title={Joint estimation of non-parametric transitivity and preferential attachment functions in scientific co-authorship networks},
  date={2020},
  journal={Journal of Informetrics},
  volume={14},
  number={3},
  pages={101042},
}
Close amsref.✖ - [11]
- Mark Newman, Networks, Oxford University Press, Oxford, 2018. Second edition of [MR2676073], DOI 10.1093/oso/9780198805090.001.0001. MR3838417Show rawAMSref
\bib{newman2001scientific}{book}{
  author={Newman, Mark},
  title={Networks},
  note={Second edition of [MR2676073]},
  publisher={Oxford University Press, Oxford},
  date={2018},
  pages={xi+780},
  isbn={978-0-19-880509-0},
  review={\MR {3838417}},
  doi={10.1093/oso/9780198805090.001.0001},
}
Close amsref.✖ - [12]
- M. E. J. Newman, Mixing patterns in networks, Phys. Rev. E (3) 67 (2003), no. 2, 026126, 13, DOI 10.1103/PhysRevE.67.026126. MR1975193Show rawAMSref
\bib{newman2003mixing}{article}{
  author={Newman, M. E. J.},
  title={Mixing patterns in networks},
  journal={Phys. Rev. E (3)},
  volume={67},
  date={2003},
  number={2},
  pages={026126, 13},
  issn={1539-3755},
  review={\MR {1975193}},
  doi={10.1103/PhysRevE.67.026126},
}
Close amsref.✖ - [13]
- Mark E. J. Newman, Duncan J. Watts, and Steven H. Strogatz, Random graph models of social networks, Proceedings of the national academy of sciences 99 (2002), no. suppl 1, 2566–2572.Show rawAMSref
\bib{newman2002random}{article}{
  author={Newman, Mark~E. J.},
  author={Watts, Duncan~J.},
  author={Strogatz, Steven~H.},
  title={Random graph models of social networks},
  date={2002},
  journal={Proceedings of the national academy of sciences},
  volume={99},
  number={suppl 1},
  pages={2566\ndash 2572},
}
Close amsref.✖ - [14]
- Jeffrey Travers and Stanley Milgram, An experimental study of the small world problem, The structure and dynamics of networks, 2011, pp. 130–148.Show rawAMSref
\bib{travers2011experimental}{incollection}{
  author={Travers, Jeffrey},
  author={Milgram, Stanley},
  title={An experimental study of the small world problem},
  date={2011},
  booktitle={The structure and dynamics of networks},
  publisher={Princeton University Press},
  pages={130\ndash 148},
}
Close amsref.✖ - [15]
- Duncan J. Watts and Steven H. Strogatz, Collective dynamics of ‘small-world’ networks, Nature 393 (1998), no. 6684, 440–442.Show rawAMSref
\bib{watts1998collective}{article}{
  author={Watts, Duncan~J.},
  author={Strogatz, Steven~H.},
  title={Collective dynamics of `small-world' networks},
  date={1998},
  journal={Nature},
  volume={393},
  number={6684},
  pages={440\ndash 442},
}
Close amsref.✖
Jonathan Gryak is a research scientist at the Department of Computational Medicine and Bioinformatics and the Michigan Institute for Data Science, University of Michigan, Ann Arbor. His email address is gryakj@med.umich.edu

Article DOI: 10.1090/noti2471
Credits
All article images are courtesy of the author.