Mathematical Modeling
My purpose here is to try to clarify what it means to "model with mathematics," and more broadly to deal with related phrases...
 Joseph Malkevitch
York College (CUNY)
Email Joseph Malkevitch
Introduction
Recently, 45 states adopted what have come to be called the Common Core State Standards in Mathematics (CCSS-M). This document deals with a variety of content and pedagogical aspects of mathematics education for grades K-12. One section of the document deals with Mathematical Practices, and one of the mathematical practices, the fourth, uses language that is somewhat different from prior standards documents like the NCTM Standards. (NCTM refers to the National Council of Teachers of Mathematics which is the largest mathematics professional society concerned with K-12 mathematics education.)
Practice 4 sets forth the notion that students should be able to "model with mathematics." My purpose here is to try to clarify what this means, and more broadly to deal with related phrases involving "modeling," "mathematical model" and "mathematical modeling," which not everyone is familiar with.
Mathematics generates new mathematics in many ways, but in overly simple terms, I wish to call attention to two. Sometimes mathematics is developed when a problem which arises outside of mathematics is "attacked" mathematically and leads to results of interest to one or more subfields within mathematics itself. Examples of such subfields are geometry, topology, algebra, differential equations, combinatorics, graph theory, etc. By contrast, sometimes new mathematics is developed because once some body of ideas becomes part of mathematics, then mathematicians pursue this body of ideas for its own sake. Thus, extending the list of subfields of mathematics above, number theory, logic, set theory, partial differential equations, etc. as well as the subfields in the prior list each grow because questions that are already of interest in the field get extended, generalized, or become amenable to new tools that were not available in the past. Just as engineering takes known science and tries to use it in making our lives better, scholars in many disciplines take mathematical techniques and methods and apply them not only to their own disciplines but also in ways similar to what engineers do. Thus, some economists might use a differential equation for the purpose of studying economic growth, while other economists might use mathematics to understand issues related to fairness.
For example, the Nobel Memorial Prize winning economist Robert Solow developed a mathematical model using a differential equation approach for understanding economic growth. This differential equation is now known as the Solow Equation. Kenneth Arrow won the Nobel Memorial Prize for work having to do with understanding issues related to elections, rankings, and voting.
What areas outside of mathematics give rise to new mathematics? Historically, perhaps the field most often cited as a source for inspiring mathematics was the area we today call physics. However, in fact, mathematics has benefited from problems arising outside of mathematics ranging from A (art or architecture) to Z (zoology). In between, biology, botany, chemistry, dentistry, history, music, and all the other areas of knowledge have at times inspired mathematical thought. Another source of questions is human curiosity, so that questions that are part of everyday life often inspire mathematical modeling questions. It requires a certain threshold of what mathematics can do in getting insight into a variety of problems before one realizes that many stories that appear in the newspaper can be looked at in mathematical terms and that if one is open-minded enough, everyone can see the mathematics behind these problems even if they may not have the mathematical skills to attack the problems that they realize are there.
For many people it is perhaps more surprising that mathematics develops from within mathematics itself, only inspired by internal aesthetic considerations of the subject. Mathematics is often described with terms such as beautiful or elegant. For many, such words seem strange because they find it hard to understand the criteria for making such judgments. For many it is harder to understand what a beautiful theorem or proof is compared with a beautiful sunset or a beautiful melody. I will return to this issue after saying something about mathematical modeling, which offers the value of usefulness as a way of arguing for the importance of mathematics.
For example, if you are a parent with a sick 8-year-old arriving at an emergency room that is staffed with two doctors, it may occur to you that there is a mathematical approach to designing a system as to how to schedule arrivals for treatment - some people in the waiting room may have arrived earlier than others but the level of danger in not being treated quickly for later arrivals may be much higher than for people who have been waiting for some time. One can imagine a system where one of the doctors treats people independent of arrival time in order of how dangerous it is for them not to be treated quickly, while the other doctor might treat people more with regard to their arrival time. However, one might still need to take into account what to do if two very ill people arrived at the same time. Also, are there circumstances under which one or more doctors would stop working on the patient they are treating to treat a new arrival because the rapidity of the treatment for the new arrival mattered so much? With more training in mathematics students/citizens can be taught to look for other situations where similar kinds of decisions arise. Thus, scheduling treatment of patients in an emergency room has features in common with scheduling operating rooms at a hospital. There are also analogies with scheduling the use of runways at an airport, checking out customers at a supermarket, or collecting tolls at a tunnel or bridge. All of these problems have some features of "scheduling" and also features of what happens when one must wait on line. Today, mathematics has subdisciplines that study scheduling problems and queuing problems. For scheduling, some of the mathematics is deterministic (doesn't take into account randomness issues), and some has stochastic (random) aspects. Problems that involve queues also have deterministic and stochastic aspects.
Comments?
The word model
As used in common parlance the word model has many meanings. There are many phrases in which model appears in conjunction with other words. We hear of model homes, model railroads, and model planes. We hear of runway models - the glamorous women or handsome men who model clothing, including lingerie and underwear. Making model planes can be a hobby and they can be used in advertisements or museums to show people historic or interesting kinds of planes - a model of the Wright Brothers first aircraft or the new (no longer in service) supersonic plane, the Concorde. However, an aircraft company can make a model of a plane under development and test it in a wind tunnel to guarantee that its behavior is what was predicted in theory. It is much cheaper to see the pros and cons of a new design from a model than to build a prototype and then discover that its characteristics are not what one anticipated. Similarly, car manufactures will test model cars to check issues ranging from stability when making turns to gas mileage. In these contexts the word model is being used for a physical object which represents some other physical object. In many cases where industry has used physical models in the past, computer simulations or computer "models" are being substituted. A more prosaic physical model is a doll. Dolls allow children to interact with "representations" of people and thus improve social skills while having fun at the same time.
A good example of a model which has both physical and mathematical aspects is a map. No one would mistake a map for physical reality. Paper is very different from rivers, mountains, and small and large locales for human habitation - villages, towns, and cities. However, maps are an amazingly efficient way of conveying information by using a representation of the real thing rather than the real thing. For relatively small scale geography a flat map does a great job. It can be folded into a very compact space and the relative distances between things can be accurately displayed, because though the earth is approximately spherical, it is locally flat and, thus, Euclidean distance can be used for showing how far apart things are. If one is looking at airlines planning to travel between international locations in a way that minimizes the use of jet fuel, then a flat map is not a good idea. Geodesics, routes of shortest distance, on a sphere are parts of circles that pass through the center of the sphere. Two cities may be on the same latitude but flying a route of constant latitude will not minimize distance or jet fuel use. What makes model construction an art as well as a science is that what may be a good model from one point of view may not work as well from another. This explains why one sees globes and maps of the world in atlases. They are each useful for seeing different things about the world.
Mathematical modeling
Mathematical modeling is now viewed as a branch of mathematics just as algebra, geometry, number theory and topology are viewed as branches of mathematics. Because it is a relatively new designation within mathematics, the way it is described or "defined" will vary a bit from place to place. However, it is useful to note that even an established branch of mathematics such as geometry is not easy to define because the domain of what is considered geometry has changed and is changing. Mathematical modeling took off as a subject when the term started to be used in some textbook titles. The courses that these texts were used for started to proliferate. While at one time the number of students who took advantage of higher education was quite small, the number of high school graduates going on to college has grown tremendously. As the pool of people who could major in mathematics grew, there was the need for courses that provided these students with skills to get jobs which used their mathematics in some way. Mathematical modeling courses played a role here. Mathematical modeling courses also help promote the dual aspects of mathematics - theory and putting theory to work.
The characteristics of the real world are "messy." In order to use mathematics in the real world - disciplines outside of mathematics - to run government or a business better, to carry out some task faster than if one just tried any old approach, or to get a richer sense of the subject's domain, etc., one needs to make simplifying assumptions. The nature of these simplifying assumptions often is tied to the type of problem one is working on. In physics problems which are being modeled one may choose to disregard friction or the presence of wind. One may assume that an object is more symmetric than it truly is (the earth is not a sphere) or that it's homogenous in nature. Thus the skin of a fruit might not be equally smooth everywhere on its surface. In economics the nature of the simplifications made to apply mathematics to obtain understanding may take a different form. Thus, many economic phenomena don't involve "continuous time" the way the motion of a planet might, but happen via discrete transactions. However, work in physics often has suggested carry-over to economics. Thus, the notion of friction in physics is a notion that is also helpful in economics.
A mathematical model is a simplified version of the real world that employs the tools of mathematics - algebraic equations, probability, statistics, graph theory, etc. Sometimes in order to get insight into an applied problem one has to develop new mathematics rather than apply standard methods that have worked in the past. Thus, linear programming and game theory were born by the efforts of mathematicians (George Dantzig and John Von Neumann) to improve how governments and businesses carried out their operations and to attack questions in economics and political science. More commonly, one has to stretch things that have been done in the past or put together tools in a new way. Thus, one might take a differential equation which has proved insightful in the past and "tweak" it to make it useful in a situation where it has not played a role before.
To understand the intricacies of mathematical modeling it is helpful to have some visual impression of how the process works. The following diagram is a typical one of its kind, which in turn simplifies the complicated issues involved in both the subject matter and the teaching of the subject matter of mathematical modeling.

Figure 1 (Modeling diagram)
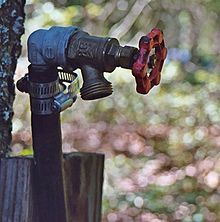
Here is a brief account of the process as indicated by the diagram. One nearly always starts with a situation (upper left box, above) or phenomenon one wants to understand better. Because this situation involves lots of messy details, one wants to simplify it using mathematical (analytical) ideas to create something more tractable. The way this is done is through stating assumptions and purposefully disregarding a lot of the details but being explicit about those details. One can think of simplification in terms of a "control valve." When the control valve (see Figure 2) is turned a lot, one simplifies a large amount, while one can turn the valve a small amount which yields a model which is "closer" to the messy real world and that is used to get the mathematical model of the real world situation.
Figure 2 (A control valve)
(Courtesy of Wiki)
Usually, an underlying real world problem that one wants to address is tied to the real world situation, though sometimes the reason for constructing a mathematical model involves little more than intellectual curiosity to understand the world better. Once one has the mathematical model for the original situation, one tries to use the mathematics to obtain understanding, which typically means trying to use the model to solve the associated real world problem. Now comes the most critical step in applying mathematics in the real world. This is represented by the arrow on the bottom of Figure 1. One is interested in seeing how much insight one gets by applying the mathematical model. Does solving the problem expressed within the model help to better understand what is going on in the real world? If the results are not "helpful" or don't give you a way to deal with the situation that concerns you, you may want to adjust the original mathematical model by altering the way you performed the simplifications in order to get a mathematical model which is more helpful.
For example, a simple way to construct a mathematical model for population growth assumes that this growth is proportional to the population. The first differential equation (*) says in words that the rate of change of the population with respect to time is proportional to the population. In (*) k is considered to be a constant (doesn't change with time or population) and when k is positive, it is an indication that the population will be growing with time.
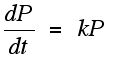
(*)
This model will predict short- and long-term exponential growth for the population. This may be true in the short run but cannot continue in the long run. Thus, one might want to modify one's population growth model. One wants to use a less simple assumption than that the growth rate for the population never changes because this model gives unrealistic predictions for the future.
The second differential equation (**) says in words that the rate of change of the population with respect to time is no longer a constant times the population. Rather, the constant growth term has been replaced by a function where the growth occurs due to a "birth constant" times the population but this growth is diminished by a constant death rate. The rate of graph is no longer a constant but a linear function.

(**)
The solution to this differential equation will be a function (the logistic function) which does not grow forever, but approaches a fixed level with time. This new model, while in many respects an improvement may still not fulfill the use for which it was designed and might have to be improved to achieve the purposes that were hoped for.
Comments?
An operations research example of modeling
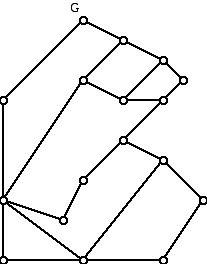
Operations research is the branch of mathematics concerned with helping governments and business operate more efficiently and smoothly. Imagine a section of urban roads consists of two-way streets (Figure 3). Once a year a line is painted down the center of each street. Design an efficient route for the truck that paints this center line, for the layout of streets shown below. The location of the garage for the painting truck is indicated at G.
Figure 3 (A schematic diagram of a section of streets)
A certain amount of modeling, simplifying, has gone on in drawing this diagram. The diagram is a schematic - it does not show stop signs, traffic lights or accurate widths for the streets, and it only hints at what the intersections of the streets are like, to name but a few of the "messy" real world details that are simplified.
To model this situation using mathematics we will use a simple geometrical diagram called a graph. A graph is a diagram consisting of dots (called vertices) to represent "things" and curved or straight line segments (called edges) to represent relationships between the things represented by the dots. In the situation above we use a dot to represent a location where two streets meet or where a street deviates from being straight and turns at an angle. The edges will represent the streets that connect up the locations where streets meet or change direction.
Figure 4 (A graph model for the streets in Figure 3)
The diagram in Figure 4 illustrates issues in combinatorial or discrete geometry. Some of the vertices (dots) have two line segments which meet at them and others have 3 or 5 line segments at them. This geometrical property of the diagram reflects the complexity of the intersections in the original street network. The line segments In Figure 4 have physically different lengths but these lengths don't have any meaning for this model. If one wants to indicate that sections of the street have different lengths or driving times, that would be done by placing a number near each edge which represents a weight or a cost or by using a metrical diagram rather than the one we have used which does not represent distance information correctly. A diagram with weights would provide more information than the diagram above. For the moment, though, we will not think of the edges as having different lengths or weights. The tradeoff in doing simplifications in the construction of a model is the amount of time it might take to analyze the model (typically more complex models take more time to understand) as well as what progress can be made in "solving" the problem one is interested in. Often (but not always) simpler models are more amenable to easier solution or insight than more complex models.
What would it mean to have an efficient route for the truck which paints the line? Presumably, we want the truck to:
a. Start and end its painting route at G
b. We want each section of street to be traversed at least once.
Finding a route that meets these requirements constitutes a reasonable goal. Presumably the truck that is used for the painting and the truck's crew (it might need more than a single driver as a crew but let us assume the task at hand can be carried out with only one person driving one truck - another modeling assumption) need to return to the garage after the painting tour. Also, it seems reasonable to require that each section of street have a line painted down it. The reason the phrase "at least once" appears is that it might be necessary to re-traverse some street sections that have already been painted in order to get to other streets where the painting has yet to occur.
It would seem rather unlikely that it would be possible to traverse each street section once and only once, but if that were possible, it would be desirable.
This leads to the following general mathematical problem:
Given a graph, when will the graph have a tour of its edges that starts at some vertex v, returns to that vertex v, and traverses each edge of the graph once and only once?
Note that while we would be surprised if we can get away with a route that does not move from one section of the town to another with no wasted work, it might happen. When we have to go along edges of the graph without doing work because the line has already been painted there, and we merely have to re-traverse an edge because we need to get to a street which has not yet had its center line painted, this is called deadheading. This term, common in operations research problems, is taken from the idea of a truck having to travel empty or not providing service during some part of its work cycle. Deadheading has come to be used as a generic term for the contrast between when work is being purposefully done and where costs are still being incurred without a service being accomplished.
As often happens in mathematics an answer to this question is already known. The answer was given (in part at least) by Leonhard Euler (1707-1783), one of the greatest mathematicians of all time. His answer came from a theoretical rather than an applied point of view.
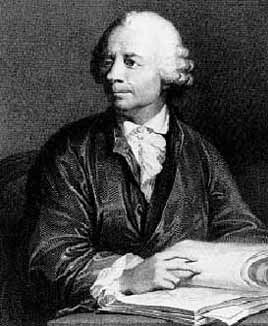
Figure 5 (Portrait of Leonard Euler)
Euler was responsible for solving what is now called the Koenigsberg Bridge Problem.
Figure 6 (A schematic of the bridge pattern in Koenigsberg in Euler's day)
Today a tour of a connected graph (one in a single piece) that starts and ends at the same vertex and visits each edge of the graph once and only once is known as an Eulerian circuit.
The Koenigsberg Bridge Problem raised the question of whether it was possible to traverse a particular collection of bridges (see Figure 6 ) once and only once returning to the start location of the tour. While it might seem that this question is quite similar to the modeling problem we are considering here, in fact, the operations research implications of what Euler originally did were not fully explored until over 200 years after Euler did his work in 1735! The formal step within mathematics was taken by Meigu Guan (Mei-ko Kwan in older publications) in 1962. What is now known as the Chinese Postman Problem grew out of his work. Possibly the reason that this huge gap in time occurred is because for large-scale applied Chinese Postman problems it is not that practical to solve the problems optimally without the use of a computer. Jumping off from Guan's work, eventually Ellis Johnson and Jack Edmonds found a polynomial time algorithm to solve the Chinese Postman Problem. Today, their algorithm is used for myriad applications.
Their algorithm solves the following question by finding, along the way, the edges that must be re-traversed to get the optimum answer:
Given a connected graph (a graph in one piece) with non-negative weights on the edges, find a shortest tour (in terms of the sum of the weights of the edges in the tour) that starts and eds at vertex A and traverses each edge of the graph at least once.
However, what is it that Euler accomplished that these later researchers built on? In one of the most simple and "elegant" arguments for a question with both theoretical and applied implications, Euler observed the following simple result.
Euler's Traversability Theorem (1735)
In order for a connected graph to have an Eulerian circuit every vertex of the graph must have an even number of edges at that vertex.
The graph in Figure 7 meets these conditions. The number of edges at a vertex of a graph is often called the valence or degree of the vertices. (The graphs we are discussing allow there to be more than one edge between the same pair of vertices but for simplicity we are not allowing graphs which have vertices that are joined to themselves with an edge.) The graph in Figure 7 is even-valent, which means that every vertex has even valence (degree). In this example, the valences are 2, 4, and 6. (Note that the graph has some crossings that are not vertices; vertices are indicated by small circles.)
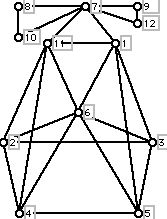
Figure 7
Here is a proof of this theorem. Whatever vertex of the graph G one picks, if G has a tour that visits each edge of the graph once and only once, then at any vertex w the number of edges that one leaves from, must equal the number of edges that one enters w on. If one leaves w on an edge, there must be a different edge (unused edge) that one reenters w on. Thus, the edges at w can be counted in pairs, and the valence of w must be even.
If a graph is connected and is even-valent (every vertex has an even number of edges at it) must the graph have an Eulerian circuit?
Euler did not specifically answer this question which was studied explicitly by later researchers. It turns out that any connected even-valent graph must have an Eulerian circuit. In fact there are a number of conceptually satisfying algorithms to find an Eulerian circuit in a way that depends on the number of edges in an even-valent connected graph with a polynomial number of operations. One idea is to paste together "circuits" that have a vertex in common. If a graph is even-valent, removing the edges of a circuit preserves the property of being even-valent so one can form an Eulerian circuit by pasting together such circuits. Typically there are many different Eulerian circuits in a graph. A theoretical mathematician would be interested in seeing if there is some way to count them all. Whenever there are multiple solutions for an applied problem, it means that one can try to achieve some important secondary objective by choosing a particular solution from among the many that one can choose from.
Unfortunately, it is relatively rare that street networks have graphs that have all their vertices even-valent. The graph shown in Figure 4 does not have this property. If some streets must be traversed more than once, several issues might come into play. It is possible that the amount of time to traverse a street in paint mode might be different from the amount of time that the truck could traverse a street if it was not painting, but instead just moving between a part of the network where painting had occurred to another part where painting had not yet occurred. These are modeling issues. One of the important aspects of mathematical modeling is that it leads one to think in the way we just did.
In some situations it may be reasonable to assume that all of the edges in a graph such as that in Figure 7 require equal amounts of time to paint a line down the street that the edge represents. Even if this is not realistic, it might be a good place for a theoretical mathematician to start in trying to find an efficient route.
If we make the assumption that the edges of a (connected) graph have the same cost or weight, we have a special case of the Chinese Postman Problem to consider. What is required to solve this problem is a way to duplicate existing edges in the graph under consideration so that the result is a graph which has an Eulerian circuit. Duplicating existing edges to make a graph even-valent is called eulerizing the graph. It is not hard to show that the number of odd-valent vertices in any graph is even. Thus, the number of edges necessary to eulerize a graph is at least as large as the number of odd-valent vertices in the graph divided by 2. We cannot hope for better than making two odd-valent vertices into even-valent vertices by repeating a single edge, and we might do worse than this. Note that if a graph G does not have an Eulerian circuit, we can always add edges equal in number to half the number of odd-valent vertices to obtain a new graph H which has an Eulerian circuit. However, this will often involve using edges that don't duplicate existing edges in the graph. To see the difference consider the graph in Figure 8. To eulerize this graph we need to duplicate every edge of the graph even though the number of odd-valent vertices in the graph is 2!

Figure 8
While adding the edge from vertex 0 to vertex 7 turns the graph into a new graph which has an Eulerian circuit, the edge 07 does not duplicate an existing edge. To eulerize the graph one needs to repeat every edge, even though the number of odd-valent vertices is only 2. The reason we care about duplicating existing edges to obtain a graph with an Eulerian circuit rather than just adding any edges to get a new Eulerian graph is that the original graph is a model for an actual applied problem in painting lines down edges of existing roads. The edge 07 probably does not exist as a road in this situation! Only by duplicating existing edges do we get further insight into the the applied problem which concerns us. For many actual graphs with odd-valent vertices one can find a trial and error solution which is optimal. However, if one needs to find an optimal solution one can use the algorithm developed by Edmonds and Johnson. From a theoretician's point of view one might not only be interested in finding one optimal duplication pattern but all duplication patterns.
Part of the process of mathematical modeling parallels the important skills that mathematicians value - generalization and abstraction. In the problem that we have been considering we looked at a question about painting a line down the middle of a collection of streets. While this type of problem certainly occurs, it has a limited domain of applicability. So it seems natural to try to find problems which "sound" similar to this one. It is not that hard to find examples of urban operations research questions where a "service" has to be performed along the edges of a graph:
* garbage collection
* mail delivery
* street sweeping
* parking meter inspection
* delivering flyers for a newly opening business
* cutting the grass along a highway
* snow removal
* using water trucks to clean streets
and many other examples.
What distinguishes these problems is that the road networks involved may not consist of only one-way streets, that the work might be done by someone who was on foot rather than in a truck, and a host of other "messy" details. However, finding efficient ways of solving these problems saves taxpayers money or just provides better service. The applied and theoretical mathematics problems that are inspired by such questions are fascinating. Modeling questions are fun to work on and the mathematics they lead to, whether or not it can be put to applied use, is often very exciting.
Comments?
The theory and practice of modeling
A pioneer in describing and promoting the teaching of mathematical modeling has been Henry O. Pollak. Pollak was an undergraduate at Yale but got his doctorate degree in mathematics at Harvard. His thesis advisor was Lars Ahlfors, who along with Jesse Douglas, won the first Fields Medals.
Figure 9 (Photo of Henry Pollak, courtesy of Henry Pollak)
However, unlike many mathematicians trained to do research in mathematics, Pollak got involved with mathematics in the world outside of mathematics. In 1951, after finishing his doctorate he took a job at Bell Laboratories and eventually became director of its Mathematics and Statistics Research Center. After retiring from industry he has pursued a teaching career at Teachers College at Columbia. During his long and distinguished career he wrote joint research papers with a number of distinguished theoretical and applied mathematicians: Ronald Graham, David Slepian, Edmund Gilbert, Edward Coffman, Lawrence Shepp, David Johnson and Henry Landau as well as having been issued patents. During his long involvement with "industry" Pollak was involved with mathematics education. He was a member of CUPM (the Committee on the Undergraduate Program in Mathematics) from 1959 to 1965 as well as being involved with the School Mathematics Study Group (SMSG) and served as president of the MAA, the first person to hold that position from outside of academia, from 1975 to 1976. More important he has written wisely and extensively about the nature of mathematics and mathematical modeling.
What experience with mathematical modeling has shown is that mathematical modeling issues can be tied to questions that arise in all the major traditional branches of knowledge such as the humanities, social sciences, physical sciences, etc. Thus, a biblical scholar might want to know if two texts coming from antiquity that seem to have different tones or styles, were indeed written by different authors. A similar question would be to try to get an idea which of the many versions of the Canterbury Tales that have come down to the present day might be closest to the original because there is no "autograph" copy of this work. Mathematical modeling techniques have been used to determine whether paintings attributed to a particular person are likely to have been painted by that person. In the area of social sciences with the development of new kinds of financial instruments such as futures and options, the question about how these instruments should be priced emerged. The Black-Scholes Equation, which also had input from Robert Merton, is an example of how mathematics was used to obtain an answer to a question that arose from the practical arena of financial markets. However, once the Black-Scholes equation was formulated, theoretical mathematicians took an interest in understanding the behavior of the partial differential equations that lie in part at the heart of what was done. After the successes of work like the Black-Scholes equation, many other financial mathematical models were developed related to complex financial instruments and investment strategies.
Members of the mathematical community have in very recent years come under attack for their work because mathematical models developed by them have had negative consequences - particularly some models involved in the financial industry. When an unskilled person works with hammers, saws, and other common tools, accidents can occur. The analogue of this is that when mathematical models which have been successful in the domain they were designed for are used more extensively, they sometimes don't yield good results. Mathematical models are always simplified versions of reality and when the assumptions of the models are not met the models may or may not work well. Many financial models operate properly in situations that are typical rather than those that occur very rarely. When a rare collection of circumstances holds they may give poor results. If one uses a tool over a sufficiently long time horizon, the probability that "rare" events will occur eventually can rise to a high level. It is the analogue of the 200-year flood. Such events do not occur often but they do occur.
With the advent of Mathematical Practice 4 of the Common Core State Standards in Mathematics, "Model with mathematics," hopefully Americans will improve their ability to use mathematics in their daily lives and be taught the skills that will make it possible for them to effectively do so.
References
Andrews, J. and R. McLone, Mathematical Modelling, Butterworths, London, l976.
Banks, R., Slicing Pizzas, Racing Turtles, and Further Adventures in Applied Mathematics, Princeton U. Press, Princeton, 1999.
Beltrami, E., Models for Public Systems Analysis, Academic Press, New York, l977.
Beltrami, E., Mathematics for Dynamic Modeling, Academic Press, Orlando, l987.
Beltrami, E., Mathematical Models in the Social and Biological Sciences, Jones and Bartlett, Boston, 1993.
Bender, E., An Introduction to Mathematical Modeling, Wiley, New York, l978.
Clark, C., Mathematical Bioeconomics: The Optimal Management of Renewable Resources, Wiley, New York, 1976.
COMAP, For All Practical Purposes, 9th edition, W. H. Freeman, New York, 2012. (The first edition appeared in 1988, and more than for many texts, later editions differed considerably from each other.)
COMAP, Modeling Our Work, Lexington, 1999.
Dym, C. and E. Ivey, Principles of Mathematical Modeling, Academic Press, New York, 1980.
Edwards, D., and M. Hamson, Guide to Mathematical Modelling, CRC Press, Boca Raton, 1990.
Giordano, F. and M. Weir, A First Course in Mathematical Modeling, Brooks/Cole, Monterey, l983.
Haberman, R., Mathematical Models, Prentice-Hall, Englewood Cliffs, l977.
Harary, F. and R. Norman, Graph Theory as a Mathematical Model in Social Science, U. Michigan Press, Ann Arbor, 1953.
Helly, W. Urban Systems Models, Academic Press, New York, l975.
Kalman, D., Elementary Mathematical Models, MAA, Washington, 1997.
Kingsland, S., Modeling Nature, U. Chicago Press, Chicago, l985.
Klamkin, M. (ed.), Mathematical Modelling: Classroom Notes in Applied Mathematics, SIAM, Philadelphia, l987.
Lancaster, P., Mathematics: Models of the Real World, Prentice-Hall, Englewood Cliffs, 1976.
Maki, D. and M. Thompson, Mathematical Models and Applications, Prentice-Hall, Englewood Cliffs, 1973.
J. Malkevitch and W. Meyer, Graphs, Models and Finite Mathematics, Prentice-Hall, Englewood Cliffs, 1974.
Meerschaert, M., Mathematical Modeling, Academic Press, New York, l993.
Meyer, W., Concepts of Mathematical Modeling, McGraw-Hill, New York, 1984.
Noble, B., Applications of Undergraduate Mathematics in Engineering, Macmillan, New York, l967. Nobel, B., Applications of Undergraduate Mathematics in Engineering, Macmillan, New York, 1967.
Olinick, M., An Introduction to Mathematical Models in the Social and Life Sciences, Addison-Wesley, Reading, 1978.
H. Pollak, Applications of Mathematics, In Mathematics Education, Sixty-ninth Yearbook of the National Society for the Study of Education, (ed.) E. Begle, National Society for the Study of Education, Chicago, 1970, pp. 311-334.
H. Pollak, The interaction between Mathematics and other school subjects, in New Trends in Mathematics Teaching, IV, UNESCO, Paris, 1979, pp. 232-248.
H. Pollak, Solving problems in the real world, in Why Numbers Count: Quantitative Literacy for Tomorrow's America, (ed.) L. Steen, College Board, New York, 1997, pp. 91-105.
H. Pollak, A History of Teaching Modeling, in A History of School Mathematics, (ed.) G. Stanic, and J. Kilpatrick, Volume 1, NCTM, Reston, 2003, pp. 647-672.
Pollard, A., Mathematical Models for the Growth of Human Populations, Cambridge U. Press, Cambridge, 1973.
Roberts, F., Discrete Mathematical Modeling, Prentice-Hall, Englewood Cliffs, l976.
Roberts, F., (ed)., Applications of Combinatorics and Graph Theory to the Biological and Social Sciences, Springer-Verlag, 1989.
Roberts, F. (ed.), Applications of Discrete Mathematics, Society for Industrial and Applied Mathematics, Philadelphia, 1988.
Joseph Malkevitch
York College (CUNY)
Email Joseph Malkevitch