Mathematics and Chemistry: Partners in Understanding Our World
In a series of columns I will give a sketch of some of the issues arising from using mathematics in fields outside of mathematics, but for this column I will use examples from the area of chemistry...
 Joseph Malkevitch
York College (CUNY)
Email Joseph Malkevitch
Introduction
Which came first, the chicken or the egg? Trying to answer this question is a bit like trying to ask for mathematics, which came first, theoretical mathematics or applied mathematics?
In a series of columns I plan to demonstrate that theory and applications of mathematics are, and have always been, linked together. Typically mathematics generated seemingly only for intellectual curiosity eventually finds use outside of mathematics itself. Moreover, questions born outside of mathematics usually spark new theory. Society and mathematics are both better off because of this partnership.
Here I will give a sketch of some of the issues arising from using mathematics in fields outside of mathematics, but for this column I will use examples from the area of chemistry. Not surprisingly as mathematics has produced more tools for chemists to put to use, the chemists have done so. For example, chemists use group theory to study aspects of their field, but this as a mathematical tool came much later than the first work that made chemistry more "mathematical." Of course, it was a revolution just to develop an experimental approach to chemistry - carrying out procedures under controlled circumstances many times and seeing if one got repeatable results. Controlled experiments open the door to using mathematical tools from statistics and from the field of experimental design.
When people think about theoretical mathematics they often think of the Pythagoreans and Euclid's Elements. For example, the Pythagoreans are reputed to have been the earliest to think about the issue of irrational numbers. A number which is the ratio of two integers a and b, where b is not zero, is called rational. For measuring lengths, areas, and volumes in practical terms the way a chemist might need to, one can get away with only rational numbers. Despite the fact that one can conceptualize about numbers, the real numbers, which are not all rational, these numbers and lengths can be approximated "arbitrarily" close using only rational quantities. Famous examples of irrational numbers are √ 2 , π, and e (the base of the natural logarithm system -although base 2 and 10 are used more often). A chemist might be interested in knowing the volume of the region in space bounded by a Euclidean sphere whose exact value is (4/3)πr3, but for any particular radius it is good enough to work with rational numbers. Chemists also don't particularly care if one represents numbers in base 10 or with some other system. The units for measurements that are chosen vary from the metrical system to the one still used, with many disadvantages, in the United States.
The world of chemistry involves the creation of molecules from the atoms that occur naturally in the world. There are 92 such elements and they have complex properties - some are gases, some are liquid, and some are solid at "room" temperature (although there is some debate about the number of naturally occurring elements, 92 is the number most often cited). From the very beginnings of chemistry, mathematics was used to create quantitative and qualitative models for helping comprehend the world of chemistry by understanding the elements that make up molecules. An atom is made up of particles which are known as protons, neutrons, and electrons. Measurement issues concerning these particles are a big part of what chemistry is about. Protons, neutrons, and electrons have mass and they have electrical charge (or the lack thereof) and mass and charge can be measured. Patterns in the mass and charge of atomic particles helped chemists get insight into the nature of atoms and the molecules these atoms can form.
We take for granted today that molecules are made from elements of different kinds but this insight is relatively new. We now know there are 92 naturally occurring types of atoms, though some of these elements come in different forms, where the atoms differ in their atomic weight. Numbers have been used to understand the structure of these elements and to classify them into families with similar kinds of chemical properties. This leads to the notion of the periodic table - to try to organize the elements into "clusters" which have similar properties, and then use this information to understand the properties of these elements. While history has governed the form used to display the "periodic" nature of the elements, various new proposals have been made that some suggest would be more insightful than the usual periodic table. After all chemists, too, look for patterns just the way mathematicians do!
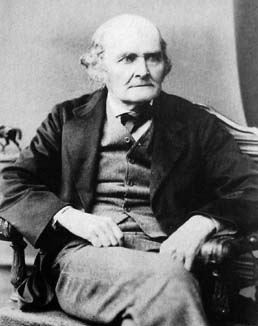
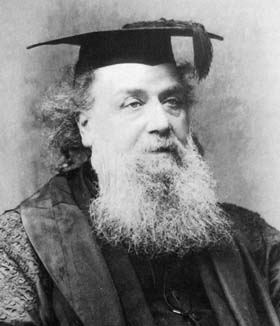
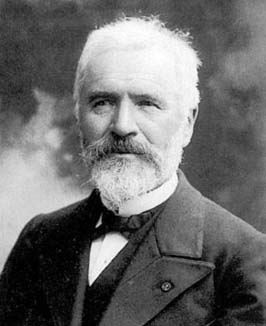
While not surprisingly those who contribute to chemistry have training in chemistry, they can still put to use the mathematics they learn in support of their research into chemistry. However, it is also true that people who start as mathematics majors can become very distinguished research chemists. One dramatic example is the career of Herbert Hauptman, who started out as a mathematics major (at City College in New York) but eventually went on to win the Nobel Prize in Chemistry.
.
Herbert Aaron Hauptman (1917-2011) (Courtesy of Wikipedia)
Comments?
Balance
One interaction of mathematics and chemistry that is so familiar now that it is taken for granted, is the way certain quantities are balanced or preserved when a chemical reaction occurs. In a chemical reaction the masses of the inputs to the reaction must be the same as the masses of the products produced by the reaction.
A good example of the complex ways mathematics helps one grasp chemistry issues is the recent concern with rising levels of carbon dioxide in the atmosphere, and the pollution that comes from using coal as a source of energy. One way to deal with the issue of the negative aspects of burning coal is to use more natural gas, whenever possible, as a source of energy. One of the major components of natural gas is methane. Methane is an example of a hydrocarbon, a molecule made up of hydrogen and carbon atoms. Methane when ignited undergoes a chemical reaction that releases energy. The energy is in part stored in the bonds that keep the molecule from separating into the components that make up methane - the hydrogen and carbon atoms.
In Figure 1, if one knows that methane and oxygen mix to produce carbon dioxide and water, the question is how much of each of the "reagents" are involved? Where do the coefficient numbers shown for the chemical reaction below, the 1, 2, 1, 2 respectively, come from?

Figure 1 (Balancing equations of molecular reactions) (Courtesy of Wikipedia)
It turns out that one can use ideas from the algebra learned in high school (or in a linear algebra class) to use systems of linear equations to "balance" chemical reactions in this spirit. The idea is to introduce letters for the molecules involved and then to use chemical principles for producing these equations. For example, in the equation above we have four molecules CH4, O2, CO2, and H2O. Suppose we use the letters x, y, z, w for the numbers of these molecules, respectively. Can we deduce relationships between the values of x, y, z and w? Since C appears on the left and right of the "equation" (bottom of Figure 1) we can say that x = z. What about oxygen? We have 2y = 2z + w because there are two oxygen atoms on the left, and two atoms in the carbon dioxide and one in the water. Finally for H, we have 4x = 2w. Notice here we have more "unknowns" than equations and if there is a way to balance the this reaction we will need to use nonnegative integers as the values for x, y, and z. Why not try a solution where we find the unknowns, y, z, and w in terms of x? Using some simple algebra we see that:
y = 2x
z = x
w = 2x
The smallest value x can have is 1. What does this mean for the other values? if x = 1, then y must be 2, z must be 1, and w must be 2. Thus, we get exactly the values for the coefficients of CH4, O2, CO2, and H2O we see in Figure 1. In some cases the linear equations that we get have no positive integer solutions. Either by predicting the amounts of reagents in a chemical reaction or showing that the reagents can't combine in a "legal" way, linear algebra is a tool for insight.
Visual Tools
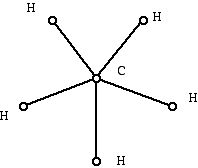
From early on chemists have used diagrams to help them think through issues involving molecules. For example, here is the way a methane molecule might be drawn.
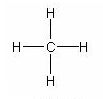
Figure 2 (Diagram of methane molecule. Courtesy of Wikipedia)
Other diagrams might give more of a sense that the methane molecule is three-dimensional, and give a more accurate feel for the molecule because the labels give information such as bond length or angles between bonds. In Figure 3 the drawing is designed to show the "tetrahedral" nature of the methane molecule, which is harder to see in Figure 2.

Figure 3 (Diagram which tries to show 3-dimensional information about the methane molecule. Courtesy of Wikipedia)
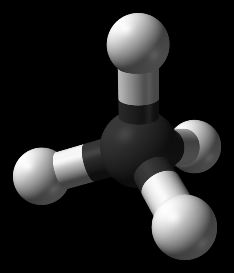
Figure 4 (Representation of the methane molecule. Courtesy of Wikipedia)
While the material I am about to discuss is probably less important in the grand scheme of things to chemistry than some other ways mathematics is helping the subject, it has the advantage of being accessible with less mathematical background. One of the things mathematics typically does is formalize "ad hoc" tools and use the general theory that evolves from the mathematical approach to advantage. Diagrams such as the one chemists might draw can be considered in the framework of geometrical diagrams called graphs. Graph theory involves studying the properties of diagrams that make use of dots and line segments. The dots of a graph are called vertices and the line segments are called edges. When chemists use these diagrams they are usually called molecular graphs or structural formulas. A structural formula for methane is shown in Figure 5. The dots represent atoms, labeled to show what kind of atom is involved, and the edges represent bonds formed between the atoms. Different authors use the same or similar terms in different ways. Here the diagram does not have metric (distance) information, and the angles between bonds and the lengths of bonds is not part of the information that the diagram is conveying. So graph theory is a kind of geometry but geometry that does not use "metrical" information directly.
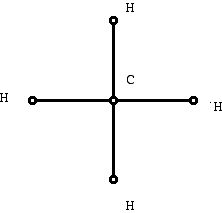
Figure 5 (Graph representing methane)
While it may seem like a small step to use Figure 5 instead of Figure 2, it is larger than appears at first glance. Using the mathematical results and ideas from the mathematics of "graph theory" opens many new perspectives for how to think about the chemistry of molecules which might not have occurred otherwise. It is natural to object that diagram in Figure 2 has been drawn in the plane, surely the methane molecule exists in three dimensional space, that it might be helpful to use a more "accurate" diagram. However, what mathematical modeling does is to make simplifying assumptions and in this case it is very helpful to work with a plane diagram even though it loses information.
Notice that even if the vertices are not labeled, if one knows that this molecule is representing a molecule consisting of hydrogen and carbon, one can recover the location of the carbon and hydrogen atoms. This is because of the notation of "valence." Different atoms "bond" with other atoms in a particular way, and this knowledge from chemistry guides what one does with graphs of chemical molecules.
Here are two other structural diagrams:
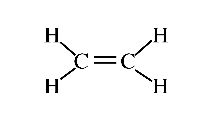
Figure 6 (Diagram showing double bond. Courtesy of Wikipedia)
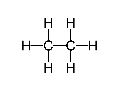
Figure 7 (Hydrocarbon with a tree structure. Courtesy of Wikipedia)
While they differ in the size of the print and the lengths of the line segments shown, they share the feature that only carbon and hydrogen atoms are present, and, thus, such molecules are known as hydrocarbons. Also notice that one of the diagrams indicates that two carbon atoms are joined with two bonds though the two molecules have the same number of carbon atoms, they differ in the number of hydrogen atoms. Thus, you will not be surprised if these molecules had different chemical and physical properties. What aspects of such diagrams make them "legal" from the point of view of a chemist? What about the diagram:
Figure 8 (Graph which can't represent a hydrocarbon)
Chemists know that the diagram in Figure 8 cannot be the structural diagram for a hydrocarbon. On the other hand, the diagram below (Figure 9):
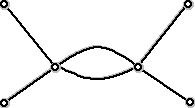
Figure 9 (Graph used to represent a hydrocarbon with double bond)
can be labeled with C's and H's so that the result is a "legal" hydrocarbon - one with two carbon atoms and four hydrogen atoms. Thus, this is a graph theory version of the diagram in Figure 6. Notice that if we count the number of edges at each vertex there are two vertices which have four edges at them and 4 vertices that have one edge at them. If we add up these numbers we get 4 + 4 + 1 + 1 + 1 + 1 = 12, which is twice the number of edges. This is a general fact, that since each edge has exactly two end points, adding up the number of edges at a vertex will always yield twice the number of edges.
What governs such diagrams from a chemist's point of view is that different kinds of atoms can form only specific allowable numbers of "bonds" with other atoms. Use of the word valence in graph theory and the theory of polytopes is "borrowed" from the chemical notation of valence. Graph theorists capture the idea of "bonding" between atoms with the concept of degree or valence of a vertex of a graph. Consider the graph below (Figure 10). It has 6 vertices and 18 edges. However, some of these edges join a vertex to itself, called a loop or self-loop, and for some vertices there is more than one pair of edges that connect the same pair of vertices. When the graph has such vertices, joined by several edges, the edges involved are called multiple edges. Some definitions of graphs don't allow for loops and multiple edges. (Some authors call graphs where loops as well as multiple edges are allowed pseudographs, while the term multigraph is reserved for the case where there are no loops but multiple edges are allowed.) But for the kind of models we want to use here, chemistry applications, we definitely want to allow multiple edges because structural formulas with "double bonds" are not uncommon. While some authors restrict the word graph to mean dot-line diagrams without loops or multiples edges, here we will allow both.

Figure 10 (Diagram of a graph with loops and multiple edges. Courtesy of Wikipedia)
In mathematics one has the "freedom" to define terms so that they capture important applications ideas (like valence in chemistry) or because they have mathematical appeal. It would be tempting to define the valence or degree of the vertices in the graph in Figure 10 as the number of edges at a vertex. However, when one does this, it is not true that the sum of the valences of the vertices of the graph adds to twice the number of edges. The "culprits" are the loops, which contribute not one edge at a vertex but two "ends" at a vertex. With this in mind we will use the following definition of valence or degree of a vertex.
Given a vertex v of a graph G the degree of the vertex is the number of local line segments at the vertex.
This means that in Figure 10 we have the following valences for the vertices:
valence(v) = 4
valence(w) = 6
valence(x) = 6
valence(y) = 5
valence(u) = 6
valence(z) = 9
Blue edges contribute 2 to the valence of vertices they are present at, red edges (those that are multiple edges) contribute 1, while gray edges contribute 1 as well. Note that some vertices have odd valence (odd number as the valence) while some have even valence (even number as the valence).
If we add the numbers 4 + 6 + 6 + 5 + 6 + 9 we get 36, which is twice the number edges, so we have 18 edges.
Theorem:
The degrees or valences of a graph sum to twice the number of edges.
Corollary:
The number of vertices of a graph of odd valence is even.
Proof: The sum of an odd number of odd numbers is odd, and so to have an even sum for the valences, we have to have an even number of odd-valent vertices.
Comments?
Graph theory in chemistry
The value of graph theory to chemistry started to become apparent in the 19th century. Work by two British mathematicians, Arthur Cayley (1821-1895) and James Joseph Sylvester (1814 -1897), laid the ground for a long tradition of successful use of graph-theoretical ideas in chemistry.
Arthur Cayley
James Joseph Sylvester
These two individuals, very different in their backgrounds and temperaments, were also remarkable for having been good friends. Sylvester never married but Cayley together with his wife came to America to visit Sylvester during his stay at Johns Hopkins University in Baltimore. For better or worse, when the term graph is used in mathematics it can mean "graph" of a function like y = x2 or a dots and lines diagram such as that in Figure 10. It was Sylvester that we have to thank for introducing this second sense of the word "graph." Perhaps surprisingly, the first use of the word "graph" for a curve is relatively recent, too.
It is Cayley's work in using what are today called graphs in chemistry that is quite significant in terms of what he accomplished and what it inspired people who followed him to do. Cayley, pioneer that he was here, had to develop his own terminology. He used the terms plerograms and kenograms for the two kinds of graphs that one might consider when studying hydrocarbons which are trees (graphs in one piece, with no circuits) when drawn as graphs. The plerogram would show all of the atoms of the molecule involved, hydrogen as well as carbon atoms. The kenogram would show only the carbon atoms.
One of the early discoveries of chemists was that molecules with the same number of carbon and hydrogen atoms (by way of an example) could have different physical or chemical properties. Chemical properties involve such things as such as which other substances a substance will react with. Physical properties include things like boiling point. Molecules which are the same chemically but different in physical terms are called isomers of each other. When molecules are represented by graph diagrams these isomers correspond to the fact that the graphs associated with them are not isomorphic (they have different structures). Graph theory is a part of combinatorial geometry (how things fit together) in the sense that its basic ideas are not rooted in metrical (area, angles, distance, etc.) but rather in structural properties. However, with some ingenuity one can obtain surprisingly large amounts of information from graphs by looking at properties that they have. We will now explore a bit of these ideas. Consider the graph in Figure 11 . What properties does it have?

Figure 11 (A connected graph used to model a hydrocarbon)
Graph theorists have developed terms for how to move around in graphs to get from one vertex to another by moving along edges. For example there are several paths from vertex e to vertex i in graph H in Figure 11. Ecbfglhi, ecflghi, and ecbglhi are all examples of different paths. These paths have lengths 7, 6, and 6 respectively because they use this number of edges in getting from e to i. However, there are "shorter" paths from e to i in the sense that they use fewer edges. Both ecbghi and ecflhi have length 5. We can define the distance between two vertices in a connected graph, (a graph having one piece) as the length of the shortest path between them. The distance between vertices e and k is 4. There is a unique path which has this distance, while the distance between e and g is 3 but there are two that give this shortest distance, ecfg and ecbg. Note that we can interpret this diagram as that of a hydrocarbon, since all its vertices are either 4-valent or 1-valent.
Some connected graphs have only one path between every pair of vertices (Figure 13). Such graphs cannot have any circuits (cbgfc and fglf are examples of circuits in the graph above). Given two vertices in a circuit, there are two paths between them along the two parts of the circuit that connect the vertices. A graph without circuits is known as a tree and trees have many nice properties, including the fact that except for the tree with a single vertex, they have at least two 1-valent vertices. Another nifty property of a tree is this:
Theorem 1:
If T is a tree where the number of vertices of T is n, then the number of edges of T is n - 1.
Perhaps even more remarkable is that the converse of this theorem is also true:
Theorem 2:
If one has a connected graph T which has n vertices and n - 1 edges, then the graph T must be a tree!
One of the accomplishments of Cayley was showing that trees play a particularly important role in getting insight into problems in mathematical chemistry. Sometimes one knows for chemical reasons the numbers of hydrogen and carbon atoms that are part of a series of chemical molecules. For example, the alkanes are a family of hydrocarbons where, if there are n carbon atoms, there are 2n + 2 hydrogen atoms, so the alkanes obey: CnH2n+2.
What will the graphs of these molecules look like? Using some simple graph theory we can see that these molecules must have a tree structure!
Since chemical molecules are connected, this means that an alkane has a total of n (carbons) + 2n + 2 (hydrogen) atoms. So in a graph of such a molecule we have 3n + 2 vertices. However, carbon is 4-valent in such a diagram while hydrogen is 1-valent. Thus we have that 4n (4 times the number of carbon molecules) + 1(2n+2) (1 times the number of hydrogen atoms) = 4n + 2n +2 = 2(3n+1), which is twice the number of bonds in the molecule. So the number of edges (bonds) in the graph of the molecule is 3n +1. Since the number of vertices 3n + 2 is one more than the number of edges, 3n +1, we can conclude by Theorem 2 that the diagrams for alkanes are always trees!
We can put together two aspects of graphs to get a fuller understanding that is useful to chemists. Given a connected graph, where are the vertices that are "in the center" or "towards the middle" of the graph? Questions of this kind date back to the French mathematician Camille Jordan, who is best known for the "Jordan Curve Theorem."
Camille Jordan
One approach to explaining in the "center" of a graph is to use these definitions.
A vertex u of a (connected) graph is called central if the eccentricity of u is as small as possible. The eccentricity of a vertex u is the farthest distance any vertex can be from u.
Remember that the distance between two vertices is the length of a shortest path between them. In Figure 11, for example, vertices d, e, i and j have eccentricity 5, vertices a, c, h and k have eccentricity 4, and vertices b, f, g and l have eccentricity 3. The central vertices in Figure 11 are b, f, g, and l.
The center C of a connected graph G consists of all its central vertices together with those edges that are present in G that join vertices of C. (Sometimes this is described by saying the center of a connected graph is the subgraph of G "induced" or "generated" by the central vertices.) In Figure 11 the center consists of 4 vertices (b, f, g, and l) together with the 5 edges, bf, bg, fl, gl, and fg.
While these definitions are intuitively appealing, for some graphs they don't give much "useful" information in a sense because every vertex can be central and thus the center of the graph is the graph itself. An example of this kind is the 3-dimensional cube, shown in two different but isomorphic drawings in Figure 12. For the cube every vertex has eccentricity 3. Cubes have lots of symmetry and since all of the vertices are alike, they all wind up as central vertices.
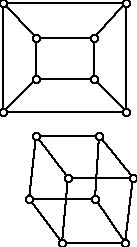
Figure 12 (Two different representations of a 3-dimensional cube)
However, the special insight here is that for trees with at least 3 vertices not every vertex can be in the center of a tree.
Theorem:
If T is a tree then the center of T is either a single vertex or a pair of vertices joined by an edge.
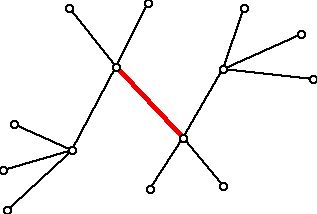
Here is an example of a tree (which represents a hydrocarbon molecule) whose center is a single edge, shown in red.
Figure 13 (Tree with a center consisting of an edge)
Another remarkable property of trees and their centers is that if one has a tree T with at least 3 vertices and removes the 1-valent vertices from the tree, the new tree T* has the same center as the original tree. For example, the tree below has the red graph left after its 1-valent vertices are "pruned." The resulting red tree has as its center a single vertex, which is the same as the center of the unpruned tree.
Figure 14 (Pruned hydrocarbon tree in red; center a single vertex)
When Cayley first began doing his work on isomers of hydrocarbons which were trees, he had to contend with making a decision about what graph theory model to use for a molecule. Tree molecule hydrocarbons have 4-valent and 1-valent vertices and we have just seen that the center of such a tree molecule is the same for the graph where the 1-valent vertices are deleted. Cayley looked at two different approaches. In one he drew the diagram he called a plerogram which includes the 1-valent and 4-valent vertices, and in the other, he drew the graph which only consisted of the carbon atoms - the structure he called a kenogram. Butane C4H10 has two isomers and the kenographs for these are n-butane (4-vertex path) and isobutane. These two "kerograms" are shown in Figure 15.

Figure 15 (Two isomers of butane, carbon atoms only)
Can you draw the plerograms for these two isomers?
Long after Cayley, Sylvester and Jordan showed that graph theory ideas were of interest to mathematicians and to researchers outside of mathematics, a chemist invigorated the use of graph theory in chemistry by inventing the Wiener Index, an invariant of a graph that is now named for him. The issue for chemists and mathematicians interested in chemistry is whether information about the graph of a molecule allows one to "predict," perhaps even approximately, different chemical or physical properties of a molecule. For molecules that form liquids at room temperature such properties might include boiling point, density, viscosity, etc. This has proven to be true.
Comments?
Wiener Index
Harry Wiener was a more recent pioneer in trying to develop an "index" for the graphs of chemical molecules which would help one grasp the physical properties of a molecule by computing information from the graph of the molecule. Wiener's idea was to look at the distances between the vertices of the graph that represented the molecule. If the molecule is a tree, what graph would best capture the properties of the molecule? One could use the graph of the connections between the carbon molecules only (kenogram), or one could use the full graph with carbons and hydrogen atoms (plerogram).
For the original Wiener Index (a term used after Wiener's work) Wiener chose to use the graph of the carbon atoms only. So the Wiener Index of a hydrocarbon is the sum of the lengths of all of the shortest paths between the vertices of the graph of the hydrocarbon consisting only of the carbon molecules. For example, let us compute the Wiener Index for the two graphs in Figure 15. Each of these graphs has 4 vertices, so we will have to add up 6 (the number of ways of selecting 2 vertices from 4) distances. For the top graph in Figure 15 we have: 1 + 2 + 3 + 1 + 2 + 1 = 10 while for the lower graph we have 1 + 2 + 2 +1 + 1 + 2 = 9. While often the Wiener Index for non-isomorphic graphs is different, there are also non-isomorphic graphs which have the same Wiener Index. This is not surprising. Mathematicians have been trying for a long time to find an easy way to tell that two graphs are isomorphic, some collection of numbers which, if these numbers are different, would guarantee that two graphs were non-isomorphic. No such "invariants" have been found nor are likely to be found. In fact, the exact complexity of the "Graph Isomorphism Problem" in the computer science sense - how much "work" is required for two graphs with n vertices to be shown to be isomorphic - is still an unsolved question. Many variants of the Wiener Index now have been explored, including not only using all of the atoms in the graph of the molecule, but when there are 1-valent vertices using only the distances between 1-valent vertices. The Wiener Index also inspires graph theory problems which may have little relation to chemistry. For example, given an integer s, is there a graph whose Wiener Index is s?
Other individuals who have tried to find graph invariants of value in chemistry, as well as working on other questions in mathematical chemistry, include Alexandru Balaban, Danail Bonchev, Ante Graovac, Ivan Gutman, Haruo Hosoya, Milan Randic, D.H. Rouvray, and Nenad Trinajstic.
Other mathematics used in chemistry
Sometimes issues of "mathematical appeal" govern attempts to discover molecules with what might have valuable properties or whose synthesis will develop new chemical "assembly" methods. For example three of the platonic solids, the tetrahedron, the cube, and the dodecahedron have vertices which are 3-valent. Can one construct hydrocarbons which have their carbon atoms at the vertices of these solids, and additional hydrogen atoms to achieve 4-valence at all of the vertices of the original solid? In particular, Figure 12 shows a 3-cube, but the right angles at the vertices made chemists wonder if such angles could be achieved for the carbon atoms of an actual molecule. Responding to this challenge, Philip Eaton and Thomas Cole constructed cubane and related compounds. Similarly, dodecahedrane has also been synthethesized but "tetrahedrane" has still not been made!
Many important applications of mathematics to chemistry involve spectra. The idea is that when a molecule moves from one energy state to another, some "signature" of the molecule can be determined, i.e. different molecules can be identified because the measurements in energy changes are characteristic of specific molecules.
This work involves the idea of eigenvalues of matrices (array or table of numbers) and other topics in linear algebra and operator theory. One goal of this work is to be able to see what molecules are present in different parts of the visible universe. Molecules of different kinds far away from Earth can be determined by a technique called spectroscopy. It is not surprising that it is easier to verify the existence of molecules with smaller clusters of atoms (molecules with few atoms) than molecules with many atoms. However, it has now been verified that there are a variety of hydrocarbons in parts of the universe that are very far from our solar system. Part of the interest in these questions is the issue of whether there is life in other parts of the universe. Human life is based on carbon chemistry molecules and so the fact that there are complex carbon molecules elsewhere in the universe raises the possibility that there are other star systems different from the Sun that have life. Mathematics has played a big role in helping with spectroscopy.
Quantum mechanics has proved to be exceedingly successful in understanding the physical world. Chemistry, as much as physics, has benefited from insights from quantum mechanics, and mathematics plays an important role in quantum mechanics.
Mathematics is in many regards unlike any other subject. In particular, after the work on DNA that resulted in understanding its role in inheritance, many facts in biology text books had to be discarded. At one time people regarded atoms as "miniature solar systems" with "planetary" electrons moving around the nucleus. Today, due to the work of Linus Pauling and others, the texts had to be altered. However, mathematical theorems stay theorems for ever! This creates a challenge for what to teach in K-12 as mathematics. It might seem that mathematical progress is mostly in areas which are too technical to treat in lower grades. However, this is not true. The very technical parts of mathematics are vibrant and healthy, but there are also recent quite easy-to- understand parts of mathematics. Not surprisingly, as the tools of mathematics have grown, its ability to be of service to other disciplines - chemistry, physics, engineering, art, etc. has expanded. While it has been known for a long time that there are 17 types of wallpaper groups for the plane, it was not until relatively recently that William Thurston and John Conway found a way of "explaining" where the 17 came from in a more elementary way than had been done in the past. In a sense this discovery has its roots in graph theory, too, since at its heart is the fact that for a plane connected graph V (vertices) + F (faces) - E (edges) = 2.
I have just scratched the surface here of how the interaction of chemistry and mathematics has enriched chemistry and the two faces of mathematics, its theoretical and applied sides.
Comments?
References
Cayley, A., On the mathematical theory of isomers, Phil. Mag., 67 (1874), 444–446.
Crilly, T. Arthur Cayley: Mathematician Laureate of the Victorian World, Johns Hopkins University Press, Baltimore, 2006.
Dias, Jerry R., Molecular Orbital Calculations Using Chemical Graph Theory, Springer 1993
Flapan, E., When Topology Meets Chemistry, Cambridge U. Press, New York 2000.
Gutman, I. and L. Popovi, Graph representation of organic molecules, Cayley's plerograms vs. his kenograms, J. of Chem. Soc., Faraday Transactions, 94 (1998) 857-860.
Gutman, I. and M. Essalth, M. El Marraki, B. Furtula, Why plerograms are not used in chemical graph theory? The case of terminal-Wiener index, Chemical Physics Letters, 568-56(2013) 195-197.
Hansen, P., and P. Fowler, M. Zheng, (eds.), Discrete Mathematical Chemistry, DIMACS Volume 51, American Mathematical Society, Providence, 1998.
Klein, Douglas J., Mathematical Chemistry! Is It? And if so, What Is It?, HYLE – International Journal for Philosophy of Chemistry, Vol. 19 (2013), No. 1, 35-85.
Parshall, K., James Joseph Sylvester: Jewish Mathematician in a Victorian World., Johns Hopkins University Press, Baltimore, 2006.
Mohar, B. and T. Pisanski, How to compute the Wiener index of a graph. Journal of Mathematical Chemistry, 2 (1988) 267-277.
Rouvray, D., The rich legacy of half a century of the Wiener index, in Rouvray, Dennis H.; King, Robert Bruce, Topology in Chemistry: Discrete Mathematics of Molecules, 2002, Horwood Publishing, pp. 16–37.
Wang, H. and G. Yu, All but 49 numbers are Wiener indices of trees, Acta Applicandae Mathematicae 92 (2006): 15–20.
Wiener, H. Influence of Interatomic Forces on Paraffin Properties. J.
Chem. Phys., 15 (1947) 766.
Wiener, H. Structural determination of paraffin boiling points, Journal of the American Chemical Society 69 (1947): 17-20.
Wilson, R. and L. Beineke, (eds.), Applications of Graph Theory, Academic Press, New York, 1979.
Publishers of chemistry education books
Those who can access JSTOR can find some of the papers mentioned above there. For those with access, the American Mathematical Society's MathSciNet can be used to get additional bibliographic information and reviews of some these materials. Some of the items above can be found via the ACM Portal, which also provides bibliographic services.
Joseph Malkevitch
York College (CUNY)
Email Joseph Malkevitch