Sustainability
Can mathematics help us understand issues of sustainability and make it possible to realize enjoyable lives for all the people who share this planet, now and far into the future?...
 Joseph Malkevitch
York College (CUNY)
Email Joseph Malkevitch
Introduction
Life gives birth to new life--plants generate new plants, fish new fish, and animals their progeny. When these life forms have economic value to mankind as the food we eat or as biofuels, it is tempting to try to arrange the management of, say, fish, so that we always have an adequate renewable supply. Why catch halibut to the point where the remaining stock of fish will die out? This is one notion of sustainability. Harvest some halibut but leave enough so that these remaining halibut can reproduce in great enough numbers so that forever into the future one can catch halibut. Similar issues arise for cutting down trees but reforesting so that there will be new trees for the future uses that mankind may put them to (wood for construction and paper). Some of these potentially renewable resources reproduce and grow relatively quickly, but others are relatively slow growing, like trees.
The earth has life on it, something that does not seem to be true for other planets in our solar system, and though on probabilistic grounds we may believe that there is life in other places in the Universe, we don't have proof of this. Being alive and self-aware is a wonderful gift, which without waxing overly philosophical is enjoyed by humans over a wide range of circumstances involving their health, wealth and ability.
Where does mathematics come in? Aside for the huge amounts of pleasure that the study of mathematics affords many people, mathematics is also a tool to understand the way that mankind interacts with the presence of other humans and species on the planet. Can mathematics help us understand issues of sustainability and make it possible to realize enjoyable lives for all the people who share this planet, now and far into the future?
April is Mathematics Awareness Month, and for 2013 the theme of Mathematics Awareness Month is the Mathematics of Sustainability. Here I will look at some mathematics applied to questions related to the growth of populations, in particular to the management of fish and ways that fish harvesting can be sustained.
Population growth
The philosopher and economist Thomas Robert Malthus (1766-1834) famously raised the issue of the relationship between the growth of human populations and the ability of the earth and mankind's skill in pursuit of agriculture to provide enough food for the earth's human population.
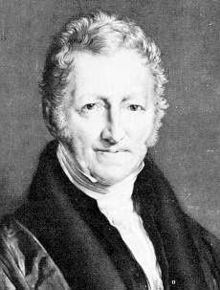
Portrait of Malthus (Courtesy of Wikipedia)
While there have been some noteworthy periods of famine where large groups of people died, on the whole farmers and others who support feeding mankind have met the challenge of keeping up with the world's growing population. This does not mean that there are not many people who die regularly from malnutrition and its consequences, and that many, including children, don't get enough food regularly and perceive themselves as hungry regularly. Most of the world's population eat relatively little meat and using the earth's resources to produce meat is a relatively inefficient way of feeding the world.
The graphic below shows the "wildly" different scenarios that have been projected for how world population will grow in the future. It is worth noting that until relatively recently we did not have very good estimates for world population and that even now there are many countries where estimates of population are very "speculative." Only in the western democracies are there fairly ongoing and reliable data for their populations on a 200-year period. The reason for the wildly different scenarios has components of the feedback loop between human population growth, wars and epidemics, and speculation that the seemingly huge growth in recent years cannot be sustained. Modern medicine and the fact that in the last 60 years there has not been another "world war" has allowed for a remarkable increase in the world's population. The world reached the milestone of 6 billion people in 1999 and 7 billion people in 2011 - a remarkably short time for this amount of growth.
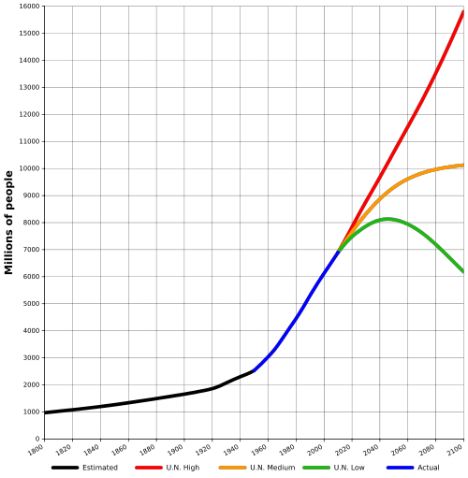
Courtesy of Wikipedia
While Malthus and others question the ability of the earth to provide food for the world's growing population, through the use of technology, biology and traditional knowledge of agriculture, so far no "catastrophe" has occurred. Yet, despite the dramatic gains for increased productivity for specific crops, many people still see what is happening as a cat and mouse game between demand for specific crops and the ability of the planet to meet those demands. The chart below shows the wheat yield in developing countries for a 55-year period.
(Courtesy of the Food and Agriculture Organization of the United Nations)
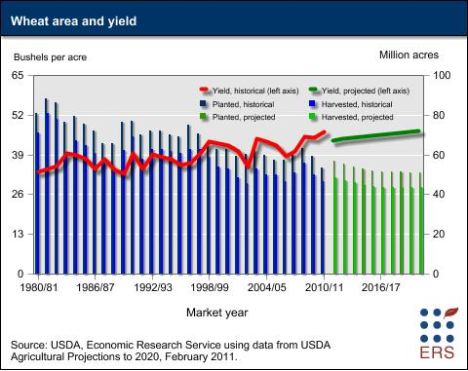
A somewhat different look at the situation for wheat is given by this table of data from the United States which shows a generally growing yield of bushels of wheat per acre but also surprisingly large downturns and upturns over short periods of time.
(Courtesy of the Economic Research Service of the United States Department of Agriculture)
However, the potential for growth in wheat production remains limited by available arable land, which, because of recent worldwide temperature changes, creates lots of imponderables.
Exploitable yield gaps for wheat: actual versus obtainable yield:
(Courtesy of the Food and Agriculture Organization of the United Nations)
Offsetting some of this encouraging data is that the price of grains and food in world markets has shown a generally upward trend, putting strain on people in all countries to feed themselves without otherwise endangering their standard of living.

(Courtesy of the Food and Agriculture Organization (UN))
Comments?
Mathematical models of population
A mathematical model involves finding ways to simplify the complex realities one might see and representing these simplified issues in mathematical terms. For example, what affects the number of people on the earth? It is affected by birth rates, death rates, weather or volcanic catastrophes that might cause a large number of people to die, deaths due to wars, or large-scale epidemics such as the flu epidemic of 1918, etc. However, one might simplify the situation by saying that "the more people there are now, the more people there will be in the near future." Using discrete mathematical methods, if we know that the number of people (population) at time t is Nt we can express the population in the next time period Nt+1 using the following recursion equation. Here I will use either N(t) or Nt to represent the number of people at time t. Time for the moment will be thought of as taking on discrete time values rather than continuous ones. In a recursion equation one will not always get integers but we can still work with the "predictions" made by thinking of numbers which are not integers as being rounded up to the next largest integer. So here is an equation which expresses the N(t+1) in terms of prior values of N(t).
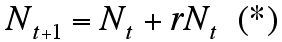
In words this equation says that the population in the next time period (next year, say) is the current population added to the growth (which could be negative) in population for one year. This growth is given by computing the growth rate r (a constant) times the population. So if r = 3% = .03 and the current population (N0) is 100,000, the growth in a year is equal to .03(100,000) or 3000 people. So, in the next time step the population would 103,000 people. It is worth noting that from a mathematical point of view this is exactly the same equation that would be used to model the growth of a bank account that pays r percent interest per time period, and where there were no withdrawals or additions(besdies interest) to the account.
Equations such as (*) are not as familiar to most people as the linear and quadratic equations of algebra but they are actually at least as useful. They are known as recursion equations or difference equations, and they are of interest both in theoretical and applied mathematics. The goal of (*) is to get an insight into applications but the famous Fibonacci numbers can be studied in terms of recursion equations:

where f(0) = 0 and f(1) = 1.
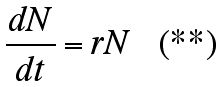
Historically, recursion equations were not studied as early as differential equations. The differential equation version of (*) is:
In words this says that the instantaneous rate of change of the number of people N at a given time is proportional to N. While this obviously captures the "biology" of population even more poorly than (*), as a mathematical model simplifying what is truly going on in the world it is a reasonable first step. The solution of this differential equation states that the population at any time t is given by:
While to fully understand what is going on with (**) one needs to study calculus, this is not the case for (*). For (**), if the initial population at time 0 is N0 then the value of the population at any time will be N0 times an exponential function. Both the differential equation and difference equation models predict that as time goes on, the population will get bigger and bigger and never stop. This is unrealistic, so what a mathematical modeler (someone who is using mathematics to get insight into the way the world behaves) does is to simplify the situation at hand in a different way. One way to do this is to assume that at some point the growth rate of population will not be constant but will reflect the size of the population itself. After all, in nature one sees some situations where the growth of a population will be "cyclical" and others where the population grows but stays in the vicinity of some value.
Probably the reason that differential equations evolved earlier than recursions was because using the calculus methods of Newton and Leibniz it was possible to solve many differential equations in "closed form." This meant that one could write down a function which gave the value, say, of population based on the model captured by the differential equation at any time in the future (or past). The development of difference equations and recursions, though preceding the development of the digital computer, came into serious interest for applications with the development of the digital computer. Computers made it possible to examine the short and long term behavior of the solutions of recursion equations which were not amenable to finding closed-form solutions. In fact, many methods that give insight into differential equations are also useful in studying how to solve difference equations. Both difference and differential equations are widely studied both from a theoretical and applied perspective. I will return to the question of getting a better population graph model than one can get using either (*) or (**) but first I would like to discuss how these improved models grew out of interest in both modeling and theoretical issues.
Comments?
Fisheries
Since ancient times the oceans have been a major source of food for mankind. Boats were built and nets sewn for the purpose of catching fish, and some cultures have been heavily dependent on the harvesting of what for a long time was thought to be the inexhaustible supply of sea life that the oceans could provide. However, the ever growing demand for fresh fish and the efficiency of modern fishing boats soon caused certain fisheries that seemed to have an unending supply of fish to collapse. An example of what seemed initially to be "let the good times roll," is shown in what happened to the stock of Atlantic cod in the fishery off Newfoundland.
Courtesy of Wikipedia
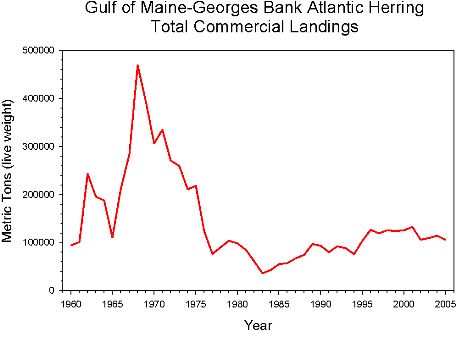
A similar situation arose with regard to the harvesting of Atlantic herring.
(Courtesy of the National Oceanic and Atmospheric Administration)
Does mathematics offer insight? The answer is yes, but we must cope with the complexities of using models that are often developed for understanding one phenomenon in situations where many phenomena are at work. First, mature fish, unlike mature people, come in a very broad range of sizes. For example, Atlantic tuna can be as large as 4.6 meters with a weight of 680 kg while an Atlantic herring maxs out at 45 cm and a weight of 1 kg. It would be helpful to have a model for relating length and weight in fish, and mathematics obliges:

where W is weight, L is length, and a and b are constants. For many species b is about 3 but the constant a varies a lot from species to species. Second, along with the size issue come issues about length of life, age to reach reproductive maturity, and public taste in what fish they most want to see on their plates. Third, there are traditions of fishing particular types of fish in different countries and in different fishing grounds. The fact that there are so many variables to consider has challenged modelers to find ways to "manage" fisheries so that the data needed to construct the model remain valid by the time the model's conclusions can be implemented in the "real world" so as to obtain the best results for all concerned. This is another big issue for fisheries models. The interests of a specific group of fishermen may not coincide with the interests of the whole nation they are a part of, and even less likely to the interests of fishermen in other countries. Many countries have no coastlines, no fisheries fleets, and yet they have an interest in the dynamism of the fisheries that provide catch for their citizens. When a group of people who are accustomed to making their living in a particular way have that pattern altered or when people are unable to feed themselves in the way that they prefer, it often will set off chains of events that can have far reaching, sometimes negative, consequences.
We can, of course, try to model the population growth of a particular fish species using the same differential or difference equation that we used for human population. However, we already saw that equations (*) or (**) require modification in order to be made "more realistic." Among the first to take this step was Pierre François Verhulst (1804-1849) who was born and died in Brussels, Belgium.
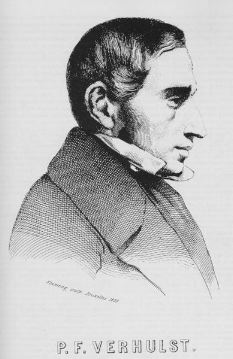
Courtesy of Wikipedia
The same approach used by Verhulst was later rediscovered by Raymond Pearl and Lowell Reed, both with ties to biology and Johns Hopkins University.
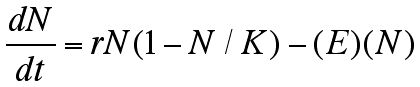
The differential equation that Verhulst looked at is
In words it says that the instantaneous rate of change of the number of fish N is given by the product of two first-degree terms. The function that solves this differential equation is known as the logistic equation. Its solution function is known as the logistic function.
Its graph is shown in Figure 1. In the equation above, when the initial number of fish N0 starts close to the carrying capacity K, the exponential term in the denominator is being multiplied by a number close to 0 so the value of N does not grow much. Also, when t = 0 the value of N(t) is N0 as it should be.
Figure 1 (Logistic curve) (Image courtesy of Wikipedia)
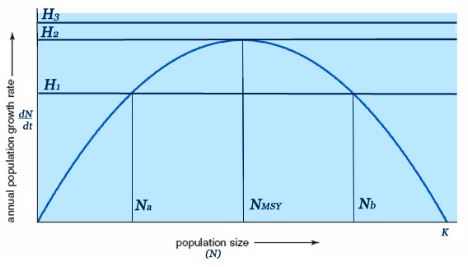
In order to understand what is going on here it is also helpful if we plot the right-hand side of the equation (***) along the horizontal axis, and the rate of change of the population along the vertical axis. We get the diagram below (Figure 2), which is a parabola.
So what is going on? The form of the differential equation shows, as you see in Figure 2, that the rate of change of the population is very small when the number of fish is near zero and also when the number of fish is near K, which is a constant often called the carrying capacity of the environment. When the there are few fish, we don't expect the number of fish to grow that much. However, if there are lots of fish, so many that the environment in which they are living makes it hard for them to find food, say, we might also expect that the fish would not reproduce at a high rate. Figure 2 shows that the value of N for which the fish produce the greatest growth is K/2. Looking at the diagram in Figure 1 we see that the population growth from a small initial stock of fish grows slowly at first, then enters a period of great growth that somewhat resembles exponential growth, but then levels off as the carrying capacity of the environment is approached. When the number of fish reaches a value close to K, we see that the number of fish remains about the same as time goes on. In this situation there is a balance between the number of fish who are born versus the number that die due to predation and to the strain that the size of the fish population makes on the environment it lives in.

Figure 2 (Image courtesy of Wikipedia)
The point in Figure 2 at the top of the parabola is labeled MSY, for maximum sustainable yield. Clearly, K/2 gives the maximum value for the population growth. If the fish population is at half the carrying capacity K, this model predicts that this is when the largest rate of growth is occurring. If one could remove this exact amount of "growth" of fish, then the population would still be the same size and continue to grow at this maximum rate of growth.
While the analysis described above is intuitively appealing, it is hard to find situations in the real world where we actually see precisely this behavior. More importantly, what is shown above is only a "more realistic" version of population growth, and does not explicitly model the way that one would harvest the fish whose population growth is described by the growth model. There are many ramifications and complexities in trying to get a model that takes into account all of the issues.
Comments?
Harvesting
The step of adding the harvesting of fish whose population growth is being governed by a logistic growth model is usually credited to H. Scott Gordon and Milner Baily Schaefer. Schaefer was born in 1912. He died at 57, having worked for the Washington State Fisheries (1937-1942) and later for the United States Fish and Wildlife Service. H. Scott Gordon appears to have developed his work on fisheries independently of Schaefer. Today their work is often referred to as the Gordon-Schaefer model. The appearance of the book Mathematical Bioeconomics: The Optimal Management of Renewable Resources by Colin W. Clark helped bring broader interest in this model, as well as bring the issue of the management of renewable resources to a much larger audience.
Here is a start at looking at how one might combine the issues of growth and harvesting fish for economic benefit.
Figure 3 (Courtesy of Wikiedia)
Let H (for harvest) represent the amount of catch that one wants to remove from the fishery. H can be thought of as a horizontal line. The situation shown in Figure 2 has been redrawn in Figure 3 where several different levels of harvesting are indicated by different horizontal lines, showing three cases of interest: when the amount of fish removed is exactly at the height of the curve when the population is K/2 (the maximum sustainable yield, MSY), a line below that level, and a line above that level. If one could succeed in harvesting at exactly the situation where a horizontal line meets the growth curve at a single point, one could be harvesting the largest potential number of fish possible. However, the chance that one is operating at exactly this ideal level is not that likely; it is likely one will have slipped into one of the other two cases. In one of these cases one has a line which intersects the growth curve in two points. Neither of these two levels of harvesting are "stable" or "an equilibrium" in the sense that one can continue to harvest at these rates forever without any change in the population level of the fishery. The only equilibrium value is the maximum sustainable yield level, when H = K/2. However, merely in practical terms, harvesting at exactly this level is not very likely. If one harvests above this level, as indicated by the fact that the horizontal line does not intersect the population growth curve, the harvesting cannot be sustained. Eventually if this level of harvesting were to continue, though it might not be initially apparent, so many fish will be removed from the system that the ability of the fish stock to recover might be destroyed. There is probably a level of "overfishing" which reduces the population of fish to a level where recovery might actually be impossible for some species, causing species extinction.
The mathematical model above is still rather naive in that it does not take into account the economics of the way fishing occurs. To fish in the open ocean involves the use of expensive boats and the paraphernalia on board the boats to catch the fish to meet the regulations for catching the fish. One way to approach this issue is to think of harvesting not in terms of a constant amount harvested but in terms of an effort function. The more "effort" (denoted by E) one exerts, the larger the anticipated catch. Often this is modeled by
One can draw a similar diagram to Figure 3 to analyze what happens by drawing a line through the origin of slope E (E for effort) instead of a horizontal line. The shape of the growth curve used in the differential equation above and shown in Figure 3 is very symmetrical. One can do the analysis here in a more qualitative way, by using non-parabolic shapes for the population growth curves. While the combining of economics and biological growth considerations are suggestive of issues that fisheries management experts must take into account, and that make a very interesting "playground" for people who are learning about mathematical modeling issues, they only hint at the complexities of the issues involved. The reason for this involves other ways of thinking about the whole system, before simplification, of managing a fishery. When a fisherman or group of fishermen invest in a very expensive new boat that meets the requirements that government may place on them, they have a strong incentive to use their boat to maximize their income. There is also the fact that when total income from fishing does not meet the needs of the individual fisherman whose life's work is fishing, boats may be used to increase income in some aspect of fishing that is not "regulated." Sometimes when governments see fishermen hurting and are nervous that people with expertise will leave the profession because in the short run they cannot make a living, the fishermen will be subsidized in a way that makes for additional complexities.
When trying to decide how to "manage" a fishery there is the issue of who "owns" the fish. While I may own my cell phone, my computer, or my home, who owns the fish in the deep ocean? Why should a country with a coastline touching the ocean have more "right" to these fish than the people in a land-locked country? Furthermore, poor countries are less likely to have the resources to harvest open ocean fish than rich countries that border an ocean. Issues of this kind have been the subject of delicate negations which resulted in the United Nations Convention on the Law of the Sea, which came into force in 1994 as the result of a long period of negotiations.
Paralleling the fact that fish are being provided to our plates (and as food for other fish and animals) is that there is a growing acquaculture industry as indicated in the graphic below. Many issues about genetically modified organisms, the spread of genes to wild stock of fish from aquacultured fish, are much in the news and being debated.

Courtesy of Wikipedia (Vertical scale in millions of metric tons)
When modeling natural fisheries, especially their economics, one increasingly has to take into account the effects of aquaculture on what happens with regard to wild capture.
The issue of fisheries is tied up with mathematical modeling of "common resources." Many countries have been protective of the wildlife within their countries, and if they have coasts on the ocean, of the resources near their shores. However, for the open oceans only those countries rich enough to mount attempts to get these resources have been able to do so. If one knows a good stream to fish one can go there regularly to one's secret spot and fish to one's heart's content. However, if one tells too many friends about the spot, it may be that over a period of time one will not be able to find good fishing every time one goes there.
The ecologist Garrett Hardin (1915-2003) pioneered the study of the economics of commons resources in a landmark article that appeared in Science in 1968, entitled "The Tragedy of the Commons."

Garett Hardin (Courtesy of Wikipedia)
Hardin's worked resonated with people who were interested in game theory. His ideas related to situations where seemingly "rational" behavior resulted in results that were bad for society (which often did not show up explicitly in the model of the game at hand) and for the individual participants in the game. With regard to ocean fisheries his work set in motion a more nuanced look at the reasons why there were fishery collapses and how to prevent future collapses. One approach to doing this is to limit access to "common resource" fisheries, to charge taxes of various kinds for being able to fish in these "common resource" fisheries, and buyback programs where governments limit catch by purchasing "excess capacity" that exists in the fisheries industry. The intrinsic complexities and game theory considerations have to some extent stymied experts in designing systems that meet the needs of both fishermen and different societies in both the developed and developing world.
I have looked briefly at some aspects of growth and sustainability in the realms of population and harvesting. Mathematics has developed many tools for understanding population and demographic models. To deal with insurance and pension considerations, the branch of mathematics known as actuarial science has had to work with making sure that rates charged for insurance are realistic in light of the changing patterns of human longevity. To be sure of the soundness of private pension plans as well as the government- run Social Security program, mathematical models are being widely used to make sure these systems continue to work properly long into the future and serve their historical function of giving security to the elderly.
Sustainability is a remarkably helpful metaphor for many aspects of governmental and corporate actions in our times. Thus, restricting ourselves to just America, we can ask about the sustainability of our road network system, our electrical grid, our health care system, our system of air travel. Mathematics will invariably be a good tool to investigate these questions. And asking questions about sustainability helps mathematics grow, too, by showing the need to develop new tools or sharpen old ones to get insight into these problems.
Comments?
References
Andelson, R. (Ed.), Commons Without Tragedy, Shepheard-Walwyn, London, 1991.
Arnason, R., Fisheries management and operations research, Eur. J. of OR, 193 (2009) 741-751.
Berkes, Fikret. Common property resources: ecology and community-based sustainable development, Belhaven Press, 1989.
Beverton, R. and S. Holt, On the Dynamics of Exploited Fish Populations, Fishery Investigations Series II Volume XIX, Ministry of Agriculture, Fisheries and Food, 1957.
Bischi, G. and F. Lamantia, Harvesting dynamics in protected and unprotected areas, J. of Econ. Behavior and Organization, 62 (2007) 348-370.
Branch, T. and R. Watson, E. Fulton, S. Jennings, C.McGilliard, G. Pablico, D. Ricardo, The trophic fingerprint of marine fisheries, Nature 468 (2010) 431-435.
Chakraborty, K. and T. Kar, Economic perspective of marine reserves in fisheries: A bioeconomic model, Mathematical Biosciences 240 (2012) 212-222.
Chopra, K. and G. Kadekodi, M. Murty. Participatory development: people and common property resources, Sage, 1990.
Clark, C., Mathematical Bioeconomics: The Optimal Management of Renewable Resources, Wiley, New York, 1976.
Clark, C., Bioeconomic Modelling and Fisheries Management, John. Wiley, New York, 1985.
Clark, C., Mathematical models in the economics of renewable resources, Siam Review 21 (1979) 81-99.
Clark, C., The Worldwide Crisis in Fisheries: Economic Models and Human Behavior, Cambridge University Press, London, 1987.
Clark, C. and G. Kirkwood, On uncertain renewable resource stocks: optimal harvest policies and the value of stock surveys, Journal of Environmental Economics and Management 13 (1986): 235-244.
Conrad, J. and C. Clark, Natural Resource Economics: Notes and Problems. Cambridge University Press., London, 1987.
Ciriacy-Wantrup, S. and R. Bishop. Common property as a concept in natural resources policy, Nat. Resources J. 15 (1975): 713.
Doyen, L. and C. Bene, Sustainability of fisheries through marine reserves: a robust modeling analysis, J. of Environmental Management, 69 (2003) 1-13.
Essington, T. and A. Beaudreau, J. Wiedenmann, Fishing through marine food webs, Proceedings of the National Academy of Sciences 103 (2006) 3171-3175.
FAO, State of World Fisheries and Aquaculture, FAO, Rome, 2008.
Gordon, H., The economic theory of a common property resource: the fishery, J. of Political Economy 62 (1954) 124-142.
Hardin, G., The tragedy of the commons, Science 162 (1968) 1243–1248.
Hardin, G., The tragedy of the unmanaged commons, Trends in Ecology and Evolution 9 (1994) 199–199.
Hardin, G., Living within limits: Ecology, economics, and population taboos, Oxford University Press, New York, 1995.
Hart, P. and J. Reynolds. Handbook of fish biology and fisheries, Volume 2: Fisheries. Blackwell, 2002.
Hilborn, R. and C. Walters, Quantitative Fisheries Stock Assessment: Choice, Cynamics, Uncertainty, Chapman and Hall, London, 1992.
Hutchings, J. et al., Trends in abundance of marine fishes, Can. J. Fish. Aquat. Sci. 67 (2010) 1205-1210.
Kingsland, S., Modeling Nature, U. Chicago Press, Chicago, l985.
Mackinson, S. and U. Sumaila, T. Pitcher, Bioeconomics and catchability: fish and fishers behavior during stock collapses, Fisheries Research 31 (1997) 11-17.
Mangel, M. and C. Clark, Dynamic Modeling in Behavioral Ecology, Princeton U. Press, Princeton, 1988.
Munro, G., The Optimal Management of Transboundary Renewable Resources, Canadian Journal of Economics, 12 (1979) 355–376.
Murawski, S. and R. Methot, G. Tromble, Biodiversity loss in the ocean: How bad is it? Science 316 (2007) 1281-1281.
Myers, R. A. and B. Worm., Rapid worldwide depletion of predatory fish communities, Nature 423 (2003) 280-283.
Ostrom, E. and R. Gardner, J. Walker, Rules, games, and common-pool resources, University of Michigan Press, Ann Arbor, 1994.
Pauly, D., The sea around us Project: Documenting and communicating global fisheries impacts on marine ecosystems, Ambio 36 (2007) 290-295.
Pauly, D., Beyond duplicity and ignorance in global fisheries, Scientia Marina 73 (2009) 215-224.
Pauly, D., Aquacalypse Now: The End of Fish, The New Republic 240 (2009) 24-27.
Pauly, D. and V. Christensen, J. Dlasgaard, R. Froese, F. Torres, Fishing down marine food webs, Science 279 (1998) 860-863.
Pauly, D. et al., Towards sustainability in world fisheries, Nature 418 (2002) 689-695.
Ryman, N., and F. Utter. Population genetics and fishery management. University of Washington Press, Seattle, 1987.
Schaefer, M. Some aspects of the dynamics of populations important to the management of commercial marine fisheries, Bulletin of the Inter-American Tuna Commission, 1 (1954) 27-56.
Schaefer, M., A study of the dynamics of the fishery for yellowfin tuna in the Eastern Tropical Pacific Ocean, Bull. of the Inter-American Tropical Tuna Commission 2 (1957) 243-285.
Sethi, S. and T. Branch, R. Watson, Global fishery development patterns are driven by profit but not trophic level, Proceedings of the National Academy of Sciences 107 (200) 12163-12167.
Shah, M. and U. Sharma, U., Optimal harvesting policies for a generalized Gordon–Schaefer model in randomly varying environment, Applied Stochastic Models in Business and Industry, 19 (2003) 43–49.
Stevenson, G., Common property economics: A general theory and land use applications, Cambridge University Press, New York, 2005.
Tahvonen, O. and M. Quaas, J. Schmidt, R. Voss, Optimal harvesting of an age-structured schooling fishery, Environ. Resource, Econ., (2012) 1-19.
Worm, B. et al., Impacts of biodiversity loss on ocean ecosystem services, Science 314 (2006) 787-790.
Worm, B., et al., Rebuilding global fisheries, Science 325 (2009)578-585.
Those who can access JSTOR can find some of the papers mentioned above there. For those with access, the American Mathematical Society's MathSciNet can be used to get additional bibliographic information and reviews of some these materials. Information related to some of the papers above can accessed via the ACM Portal.
Joseph Malkevitch
York College (CUNY)
Email Joseph Malkevitch